The Dashboard provides the main management view of the fleet. There are three views available: List View, Graph View, and Threshold View.
Dashboard Buttons
List View: the List View is the default view for the dashboard. Each parameter is presented in columns, with each gateway appearing as a single row.
List View
Graph View: The Graph View displays the same parameters as the List view but represented in graphical form. Gateways are represented on the Y axis, with the parameter value on the X axis.
Graph View
Threshold View: the Threshold view provides a summary for each parameter, including:
totals of each threshold status for the group of gateways selected.
a minimum value for each parameter for the group of gateways selected.
a maximum value for each parameter for the group of gateways selected.
Threshold View
This view is beneficial because it provides a quick view of the parameters that are out of the threshold range. The list of statisticfs displayed on the dashboard is also configured through Admin > Thresholds.
Auto-refresh (clock icon): when enabled, the browser page is automatically updated (default is 30 seconds).
Export to Excel: exports the dashboard information to an Excel file. Only the gateways showing on the current display will be exported. Change the Page Size to customize how many gateways display.
Manual Refresh: manually refreshes the AMM with the latest gateway information.
Table Grid: toggles table grid on and off.
Columns: customizes the columns displayed on the dashboard. Clicking this button provides the following options:
No additional gateway columns: When enabled, none of the additional gateway columns are displayed except Name and ID; when disabled, a selector is shown allowing you to select the additional columns to display. Select the columns of interest from the left side, click the > arrow to add them to the Selected Items list and click Save.
Use applicable thresholds in default order: when enabled, all applicable thresholds to the gateways in the Dashboard are added into the display. When disabled, a selector is shown allowing you to select columns for thresholds to display along with any additional columns selected for display. Select the thresholds of interest from the left side, click the > arrow to add them to the Selected Items list and click Save.
Page Size: customizes the number of gateways showing on the dashboard. The default is 250 gateways. The time it takes to refresh the dashboard is dependent on the page size and how many columns are being displayed.
For a default dashboard setting (total 9 columns and No Additional Gateway Columns checked), the following is a guideline of expected results.
Default Dashboard
Number of Results (page size)
Approximate Time Taken (s)
250
7.33
500
7.57
1000
8.67
2000
8.94
3000
9.54
Dashboard: List View
The List view is the default view for the dashboard. Each parameter is presented in columns, with each gateway appearing as a single row.
List View Showing Various Parameters
Parameters
The Dashboard items are made available by creating thresholds (see Thresholds
for more information). These are listed as parameters in the column headings, and descriptions for each row’s fields can be displayed by hovering the mouse over them.
The default parameters are:
Name: displays the gateway’s friendly name that was assigned to the device on the Admin>Gateways screen. If no name has been assigned, it will show as blank.
Note: in AMM 2.16.2+, the Name field for an ALEOS router will be automatically populated with the value of MSCIID 5023 if no name has been assigned to the device during gateway creation or import into the AMM. For more information see Commonly Used MSCIIDs
.
ID: displays the gateway’s serial number.
Link IP Address: the IP (Internet Protocol) address assigned to the most recent Internet connection made by the gateway.
Heartbeat: the time since the gateway last sent data to the server. The format is HH:MM:SS.
CallUp Link: the amount of time the call is up for this link connection.
Additional parameters that can be useful on the dashboard are:
Battery: the voltage level of the vehicle’s battery supplying power to the gateway. The gateway has a built-in voltage meter which monitors voltage and shuts down the unit if voltage levels are too low or too high. Note that voltage readings are subject to cable length and will always be slightly lower than the voltage measured at the source.
GPS Fix: the time since the gateway last reported its latitude/longitude coordinates.
Satellites: the gateway is equipped with a multi-channel GPS receiver. The number shown is the number of GPS satellites from which the gateway is currently receiving signals.
Temp Check: the temperature of the gateway, measured in Celsius (⁰C). The gateway has a built-in temperature sensor.
Note:
The available parameters may vary depending on the type of device(s) selected in the Gateway Tree.
CallUp Link is not supported for ALEOS routers. Battery, temp check, and calluptime are not shown for ALEOS routers.
The values for columns: Name, Vehicle Type, Group, Update DNS Servers, Customer, Location, and Contact are truncated to a configurable length of characters (the default is 40 characters).
List View: Color Coding
Color coded icons indicate the status of parameter values in relation to their defined thresholds:
Green: operating normally, within thresholds
Yellow: warning level threshold exceeded
Red: error level threshold exceeded
Blue: no data available
Note that the colored icon next to the name/serial number in the gateway list panel indicates the overall health of the gateway. The color will be based on the worst case threshold value from amongst the gateways thresholds displayed on the Dashboard.
Color Coded Icons
For example, the threshold for the 12V battery in a vehicle is typically set up to generate a warning threshold (yellow) for voltages less than 10.8V or greater than 14.7V. The error threshold (red) is set for voltages less than 10.5V or greater than 15.0V. If all other parameters are within the thresholds set (i.e. green) but the battery falls at 10.7V, then the colored icon next to Battery will be yellow. A yellow icon will also be present next to the gateway name/serial number. Note that voltage readings are subject to cable length and will always be slightly lower than the voltage measured at the source.
List View: Sorting
Data displayed in the list view columns can be sorted by clicking on the column header:
Column Headings with Arrow Indicating Sort Order
The triangle indicates which column is being sorted. When the triangle is pointing up, data is in ascending order and when pointing down, it is in descending order. By default, rows are sorted by the Name (ID).
Dashboard: Graph View
The Graph view displays the same parameters as the List view but in graphical form. Gateways are represented on the Y axis, with the parameter value on the X axis.
Values within defined thresholds appear green. Any values that are outside of defined thresholds appear as yellow (warning state) or red (error state).
Graph View
Dashboard: Threshold View
The Threshold view provides a summary for each parameter, including:
totals of each threshold status for the group of gateways selected.
a minimum value for each parameter for the group of gateways selected.
a maximum value for each parameter for the group of gateways selected.
This view is beneficial because it provides a quick view of the parameters that have exceeded a threshold.
Values Exceeding Thresholds
To display additional information about the status of the gateways, click on a numeric value in a column.
Additional Threshold Details
To see how a particular parameter is configured, click on the ellipsis (…) beside the parameter name to open the Edit Threshold panel. This will open the panel in a new browser window and allow parameter changes to be saved (for more information see Thresholds
).
 Searching...

 List View: the List View is the default view for the dashboard. Each parameter is presented in columns, with each gateway appearing as a single row.

 Graph View: The Graph View displays the same parameters as the List view but represented in graphical form. Gateways are represented on the Y axis, with the parameter value on the X axis.

 Threshold View: the Threshold view provides a summary for each parameter, including:
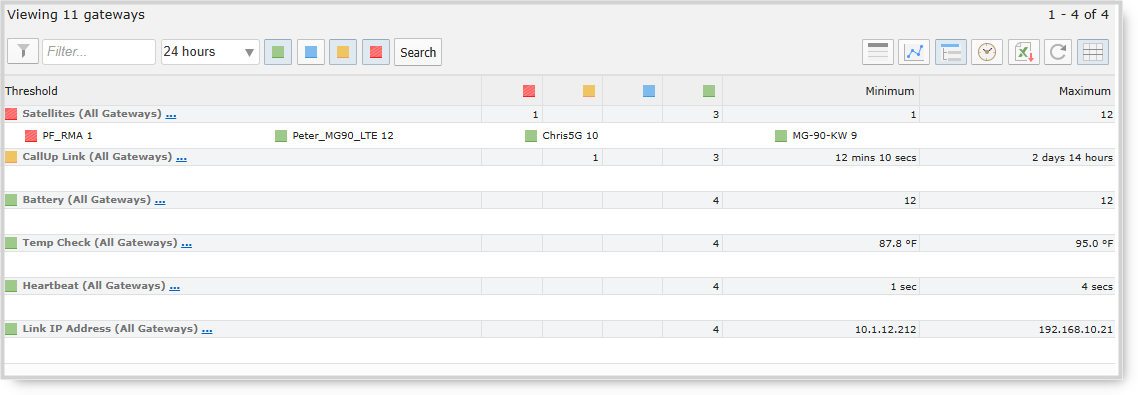

 Auto-refresh (clock icon): when enabled, the browser page is automatically updated (default is 30 seconds).
 Export to Excel: exports the dashboard information to an Excel file. Only the gateways showing on the current display will be exported. Change the Page Size to customize how many gateways display.
 Manual Refresh: manually refreshes the AMM with the latest gateway information.
 Table Grid: toggles table grid on and off.
 Columns: customizes the columns displayed on the dashboard. Clicking this button provides the following options:
 Page Size: customizes the number of gateways showing on the dashboard. The default is 250 gateways. The time it takes to refresh the dashboard is dependent on the page size and how many columns are being displayed.


