Device Management
Connect any Hardware with AirVantage
AirVantage provides simple integration with any hardware supporting MQTT.
It couldn’t be easier! Just select your hardware, get a MQTT library for your platform and send data to AirVantage using the MQTT tutorial . (And the PAHO project supplies a list of libraries in several languages).
Need some help ? Check our How-to tutorials, it covers some common devices. For each type, we explain how to send data and provide sample code for you to install.
API to Integrate with the Enterprise
AirVantage provides a comprehensive set of API you can use to quickly integrate your iot device to your business. For example
- Integrate machine data into your enterprise software CRM, ERP
- Build Smartphone or Tablet application feeded with real time data coming from connected devices
- Keep control of your fleet, deployed on the field and in your inventory, check and update the various configurations in operations
- Send commands or software updates to your entire fleet, or a selected portion, to change their behavior without having to send anyone on the field
- Build your own service portal to serve your customers without having to expose AirVantage to your customers
We provide full documentation for the API , to get you started as easily as possible.
Message Queueing
Store and forward high bandwidth device messages or events reliably at high pace to the enterprise using our Data Push option based on AMQP standard .
Big Data Storage and Analytics
Time Series Database
AirVantage store any data sent in time series without any sub sampling, so you can access 100% of the data sent.
- The System Last datapoints API can be used to get last data sent read a configuration, get the last known state of a machine (door open/closed, valve state) in order to report it in a map, a gauge or a status dashboard
- The System Multi Raw datapoints API can be used when you need to access raw data for a period of time to diagnose a machine failure or behavior, to analyze some specific sensor data or perform some proprietary analytics.
Pre Defined Statistics
AirVantage computes pre-defined statistics in real time: average value, minimum value, maximum value, sum of the values, count the number of datapoints sent, sum of squares of the values, standard deviation of the values, number of occurrences of the set of values. These statistics are available for a period of time given in the API: hour-hours, day-days, month-months, year-years. The statistics are available for any system and for the fleet.
- The System Aggregated datapoints API Can be used to
- Observe trends and patterns from data. It is applicable to any data sent to AirVantage. Examples are car mileage, car speed, water pressure, water flow rate
- Compare the behavior of a machine to other data gathered in the same period of time
- Compare a machine with a reference one, a driver from another
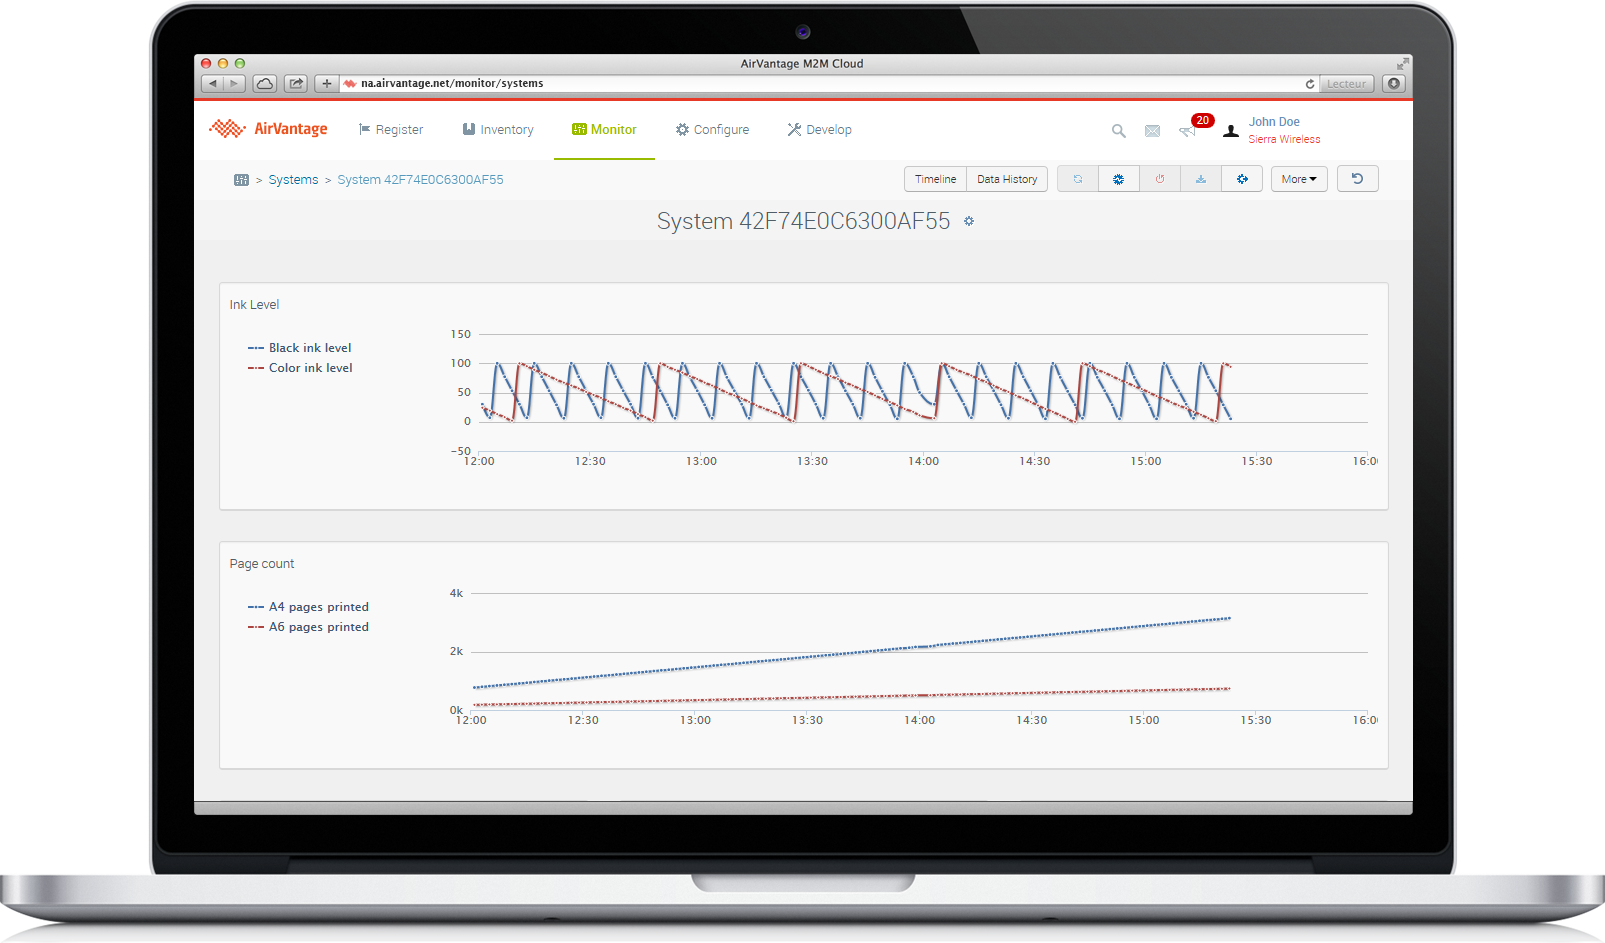
- Count events: count goods sold on a vending machine, or hard break, collision, acceleration, speed limit reached from a car, page counts on a printer
- Identify when an event occurred
- The Fleet aggregated datapoints API provides statistics for the entire fleet. The statistics for the fleet are computed from any statistic available for the systems; so you can get for a sensor data the minimum of the maximum, or average or minimum value, and so forth.
Development Tools
Deploy IOT in days, not months.
Timeline
Use the AirVantange timeline to check or troubleshoot the communications from the device to AirVantage. The timeline gives you a real-time window on data communications sent to AirVantage.
The timeline notifies you when a new communication event occurs. To start debugging, just display this page and watch update notifications appear at the top of the page as data is received.
This page is a great way of identifying
- Whether a device is communicating
- What data the device sends, and when
- Whether this data is correctly understood on AirVantage
- The frequency of each communication (check for lost communications)
Data Visualization
AirVantage provides various ways to visualize any data sent to AirVantage
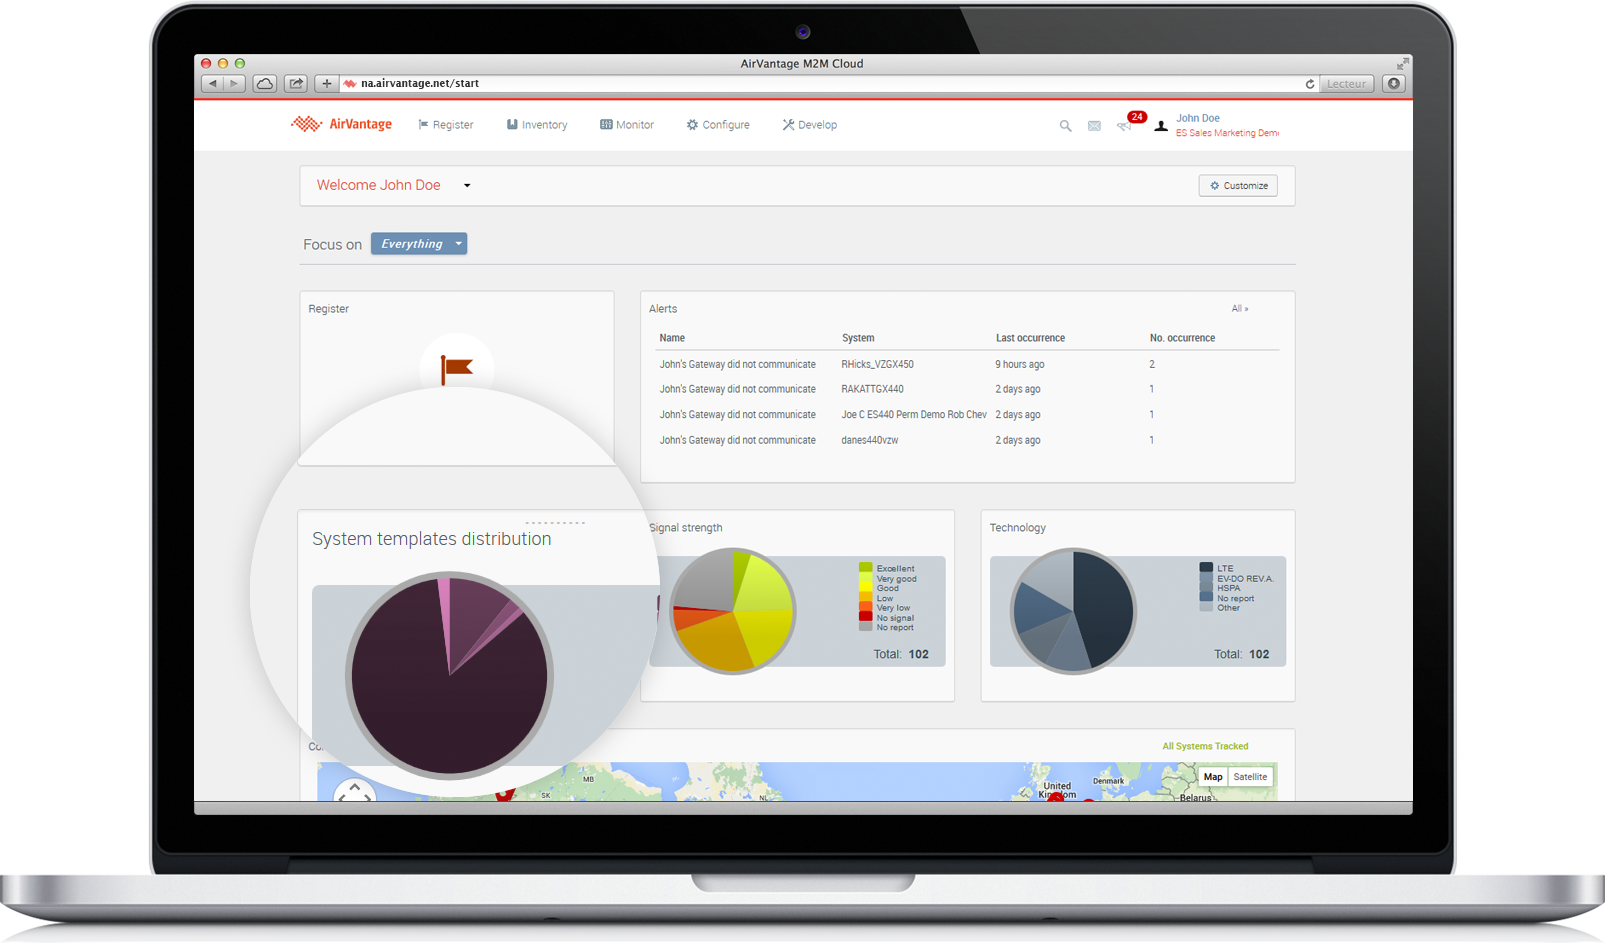
- Customizable dashboard for the entire fleet. Can show a fleet consolidated view of the data sent
- Customizable system view: choose the data you want to see
It helps you validate your embeded application without extra coding, and focus on your features. It can be used when your devices and applications are in the field, you can customize the user interface to show any data sent to AirVantage, look at the history, observe trends or issues.
Alert Rules
Quickly define alert rules in AirVantage, and be alerted as soon as a data is received from a device
- Be alerted when a device reaches or approaches a critical temperature
- Be alerted when a data usage of a site reaches a predefined level
- Be alerted when a valve is opened
Alerts can trigger emails and also automatic calls to any external application listening to AirVantage: Webhook.
Operations Management
AirVantage helps you keep large scale deployment online and secure
- Centrally configure the hardware deployed in the field. Create configuration template and apply to multiple devices.
- Update modem firmware and embedded applications over-the-air.
Administration
AirVantage provides a way for administrators to create new user accounts and define what they can see and do.
- An Administrator can define new access profiles and assign them to users
- Audit log capture all operations with associated user
- User access can be restricted using the user IP address
More AirVantage Features
And that’s just the tip of the iceberg! AirVantage provides many more features. Check out the AirVantage API Reference guide for further details.
 Searching...


