 Searching...
Getting started with the dashboard and rules
This tutorial describes how to detect a change on a system and trigger an action to automate monitoring of your device fleet, and how to visualize your operational KPI with the dashboard.
The use case in the first section is an embedded application tutorial for devices like the HL8518-S. If you use a different application, you can adapt the rules and the dashboard to your own use case.


Use case Description
To exploit data from the fleet, organizations often define a custom dashboard in AirVantage, with visual widgets and alerts.
The dashboard tutorial described later on this page could apply to a use case such as the following:
For a fleet of refrigerated trucks, containers must be monitored via AirVantage to ensure that temperature-sensitive perishable cargo (blood, chilled food…) remains within safety parameters:
- when the truck’s container door is closed, the refrigeration system (fan, compressor) must operate
- an alarm sensor checks CO2 levels to detect fire or human presence in the container
Every two days, the fan is physically checked by a maintenance engineer.
Application description
Each truck is fitted with a device that sends the following data to AirVantage:
- Variables:
- doorOpen (boolean), true if the door is opened.
- Temperature (float), just the temperature value.
- FanDuration (int between 0 and 3200 minutes): duration in minutes when the fan works
- Alarm (boolean): status of the alarm system (on/off). The CO2 rate is analyzed to raise an alert.
- Fan (Boolean): status of fan (on/off).
- CO2 Alert (Boolean): alert sent if CO2 is too high (can be sent only if alarm is on).
- Settings:
- targetTemp (float, by default is -5): defines the targeted temperature. When the temperature is reached, the fan stops.
And AirVantage must be able to send the following Commands to the truck’s device:
- Arm CO2 Alarm/Disarm CO2 Alarm (Arm command checks the door is closed).
- Start/Stop Fan (startFan checks FanDuration < 3000). Fan is automatically stopped when temp <= targetTemp.
Building the rules
Rules must be created to detect any change about your system and automate action when a given change has been detected. Thus, you can highlight a specific behavior of your system and fix the problem.
A rule must contain a:
- Name
- List of conditions
- List of actions to trigger like notifying a user by email, acting on the system, or pushing an alert to your application.
This can be implemented by defining the following rules:
- If temp > 0 then send command startFan
- If temp > 10 then send email
- If fanDuration > 3000 then send email
- If doorOpen is false and alarm is false then send command wind alarm
Create the rules
In order to simplify the creation of a rule, a set of templates is available to focus on what you want to monitor. If you want to use any of the available data and operator, choose Custom:
- Communication status change: defines a condition based on the system (name, label, offer or communication).
- Data sent to AirVantage: defines a condition based on a data from the device.
- Monthly usage limit exceeded: monthly data exchanged is greater than a given number of MB’s.
- Usage limit exceeded: defines a condition based on any connectivity metrics (voice duration, nb of SMS, etc.).
- Usage status change: defines a condition based on the data plan status.
- Custom: defines a condition with one among all the available conditions.
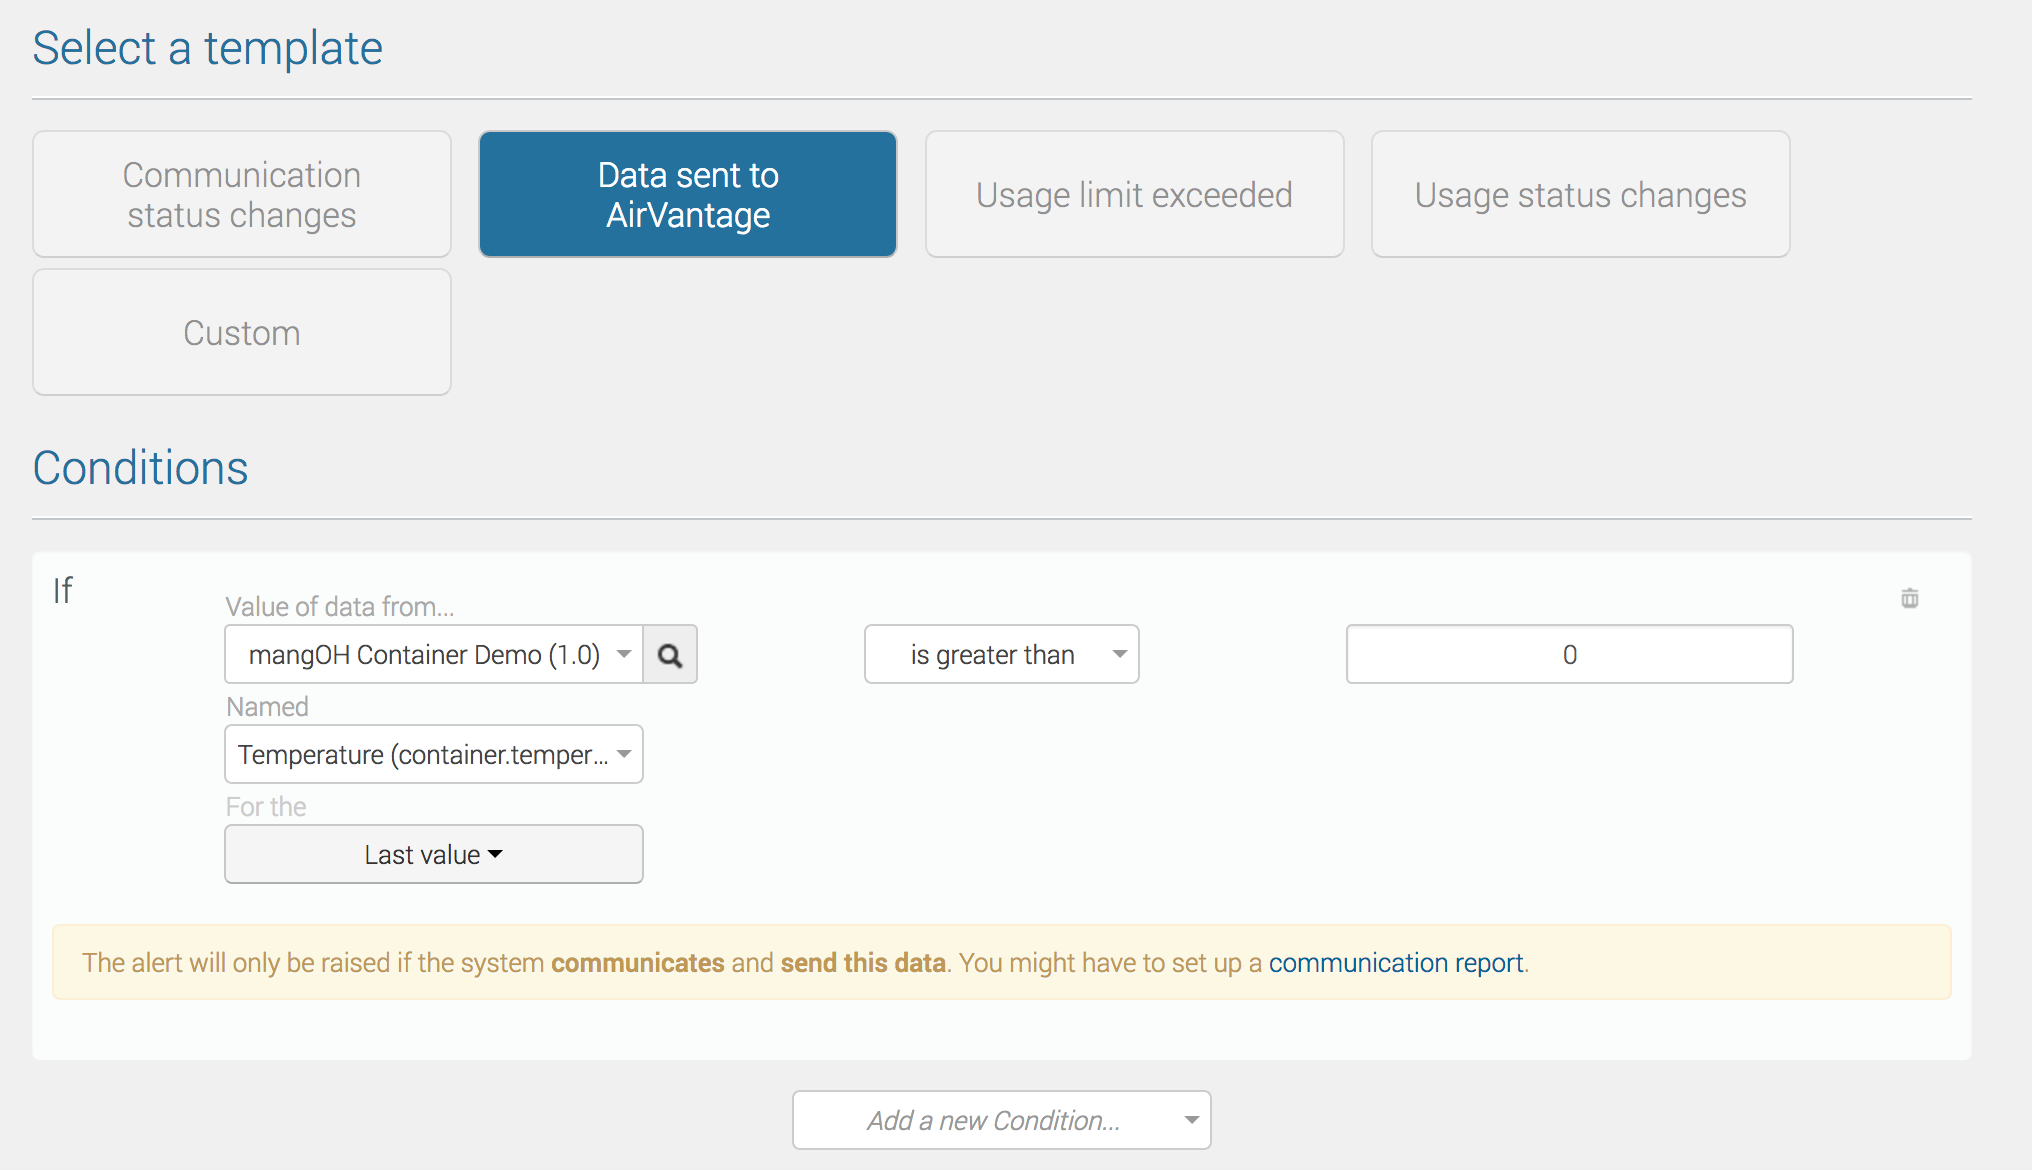
Let’s create the following rule If temp > 0 then send command startFan:
- Navigate to Configure > Alert Rules.
- Click on the + button.
- Populate the name and description. The name will be used in the interface and the connectors to show the event raised by this rule.
- Click on the
Data sent to AirVantagetemplate. - Select your application which sends the data you want to monitor.
- Select the
Temperaturedata. - By default, the last raw data value sent by the device is used but you can change to aggregated data.
- Select the operand
is greater thanand fill the right value. - Select the action
Send Commandand select the startFan command. - Select the application and the command with the parameters.
- Click on Save.
This rule creates a Send Command operation which is executed as soon as the device becomes connected with AirVantage.
You can repeat these steps for each rule you want to create.
The command will not be sent again when the conditions are no longer met. However, the
Add labelaction will remove the label when the conditions are no longer met.
View the events
Each rule will raise an event (an alert) each time the condition is met. The event can be viewed in three pages:
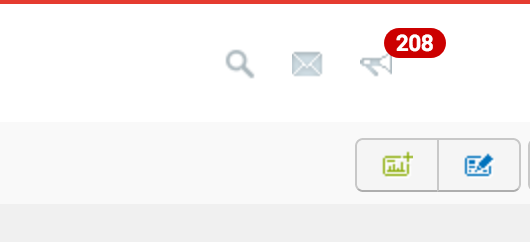
Top Bar Notification
In the top bar, a quick notification when an event has been raised. Click on the event to see more details about it.
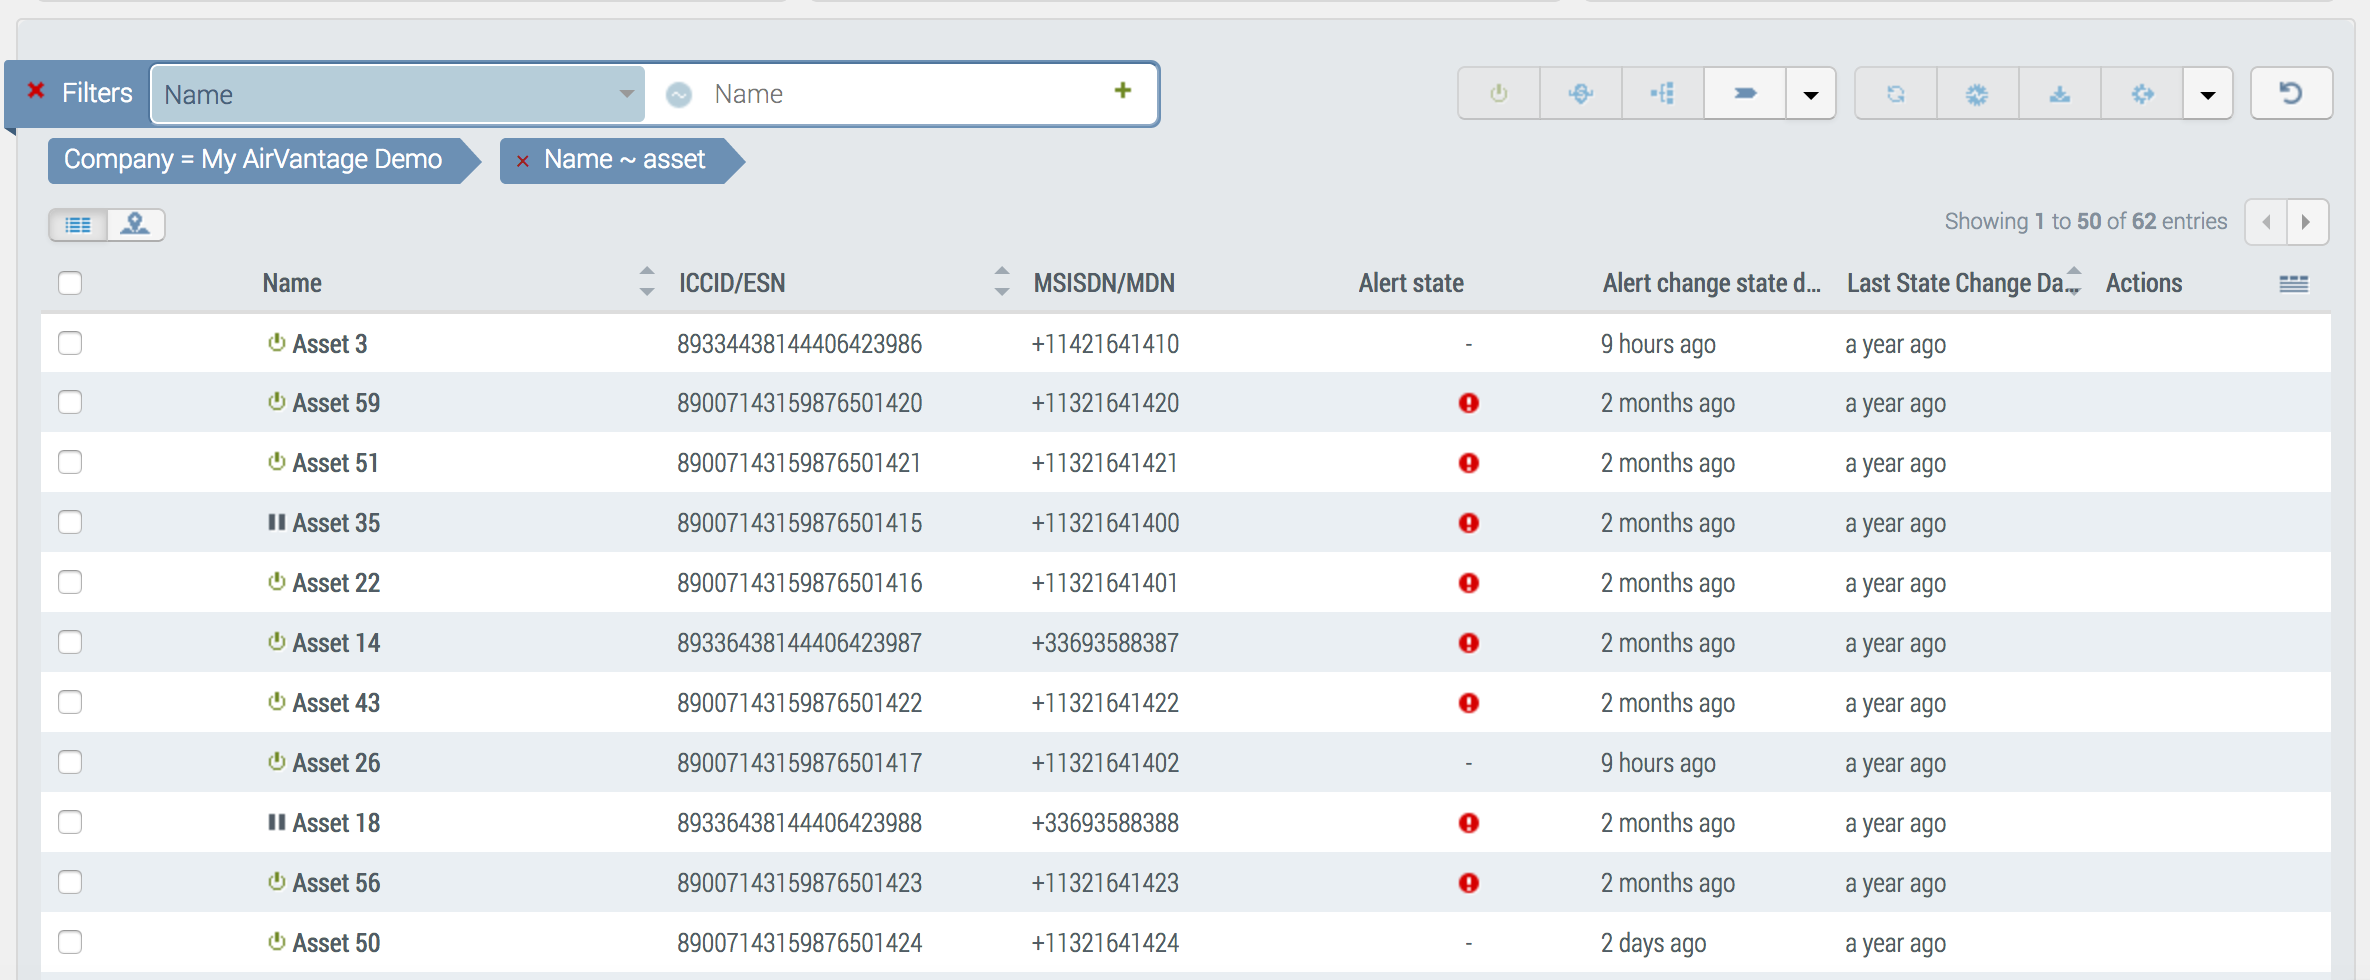
System’s Alert State
In the table in Monitor > Systems, the systems are identified in error if a problem has been detected by a rule as long as the problem is still raised.
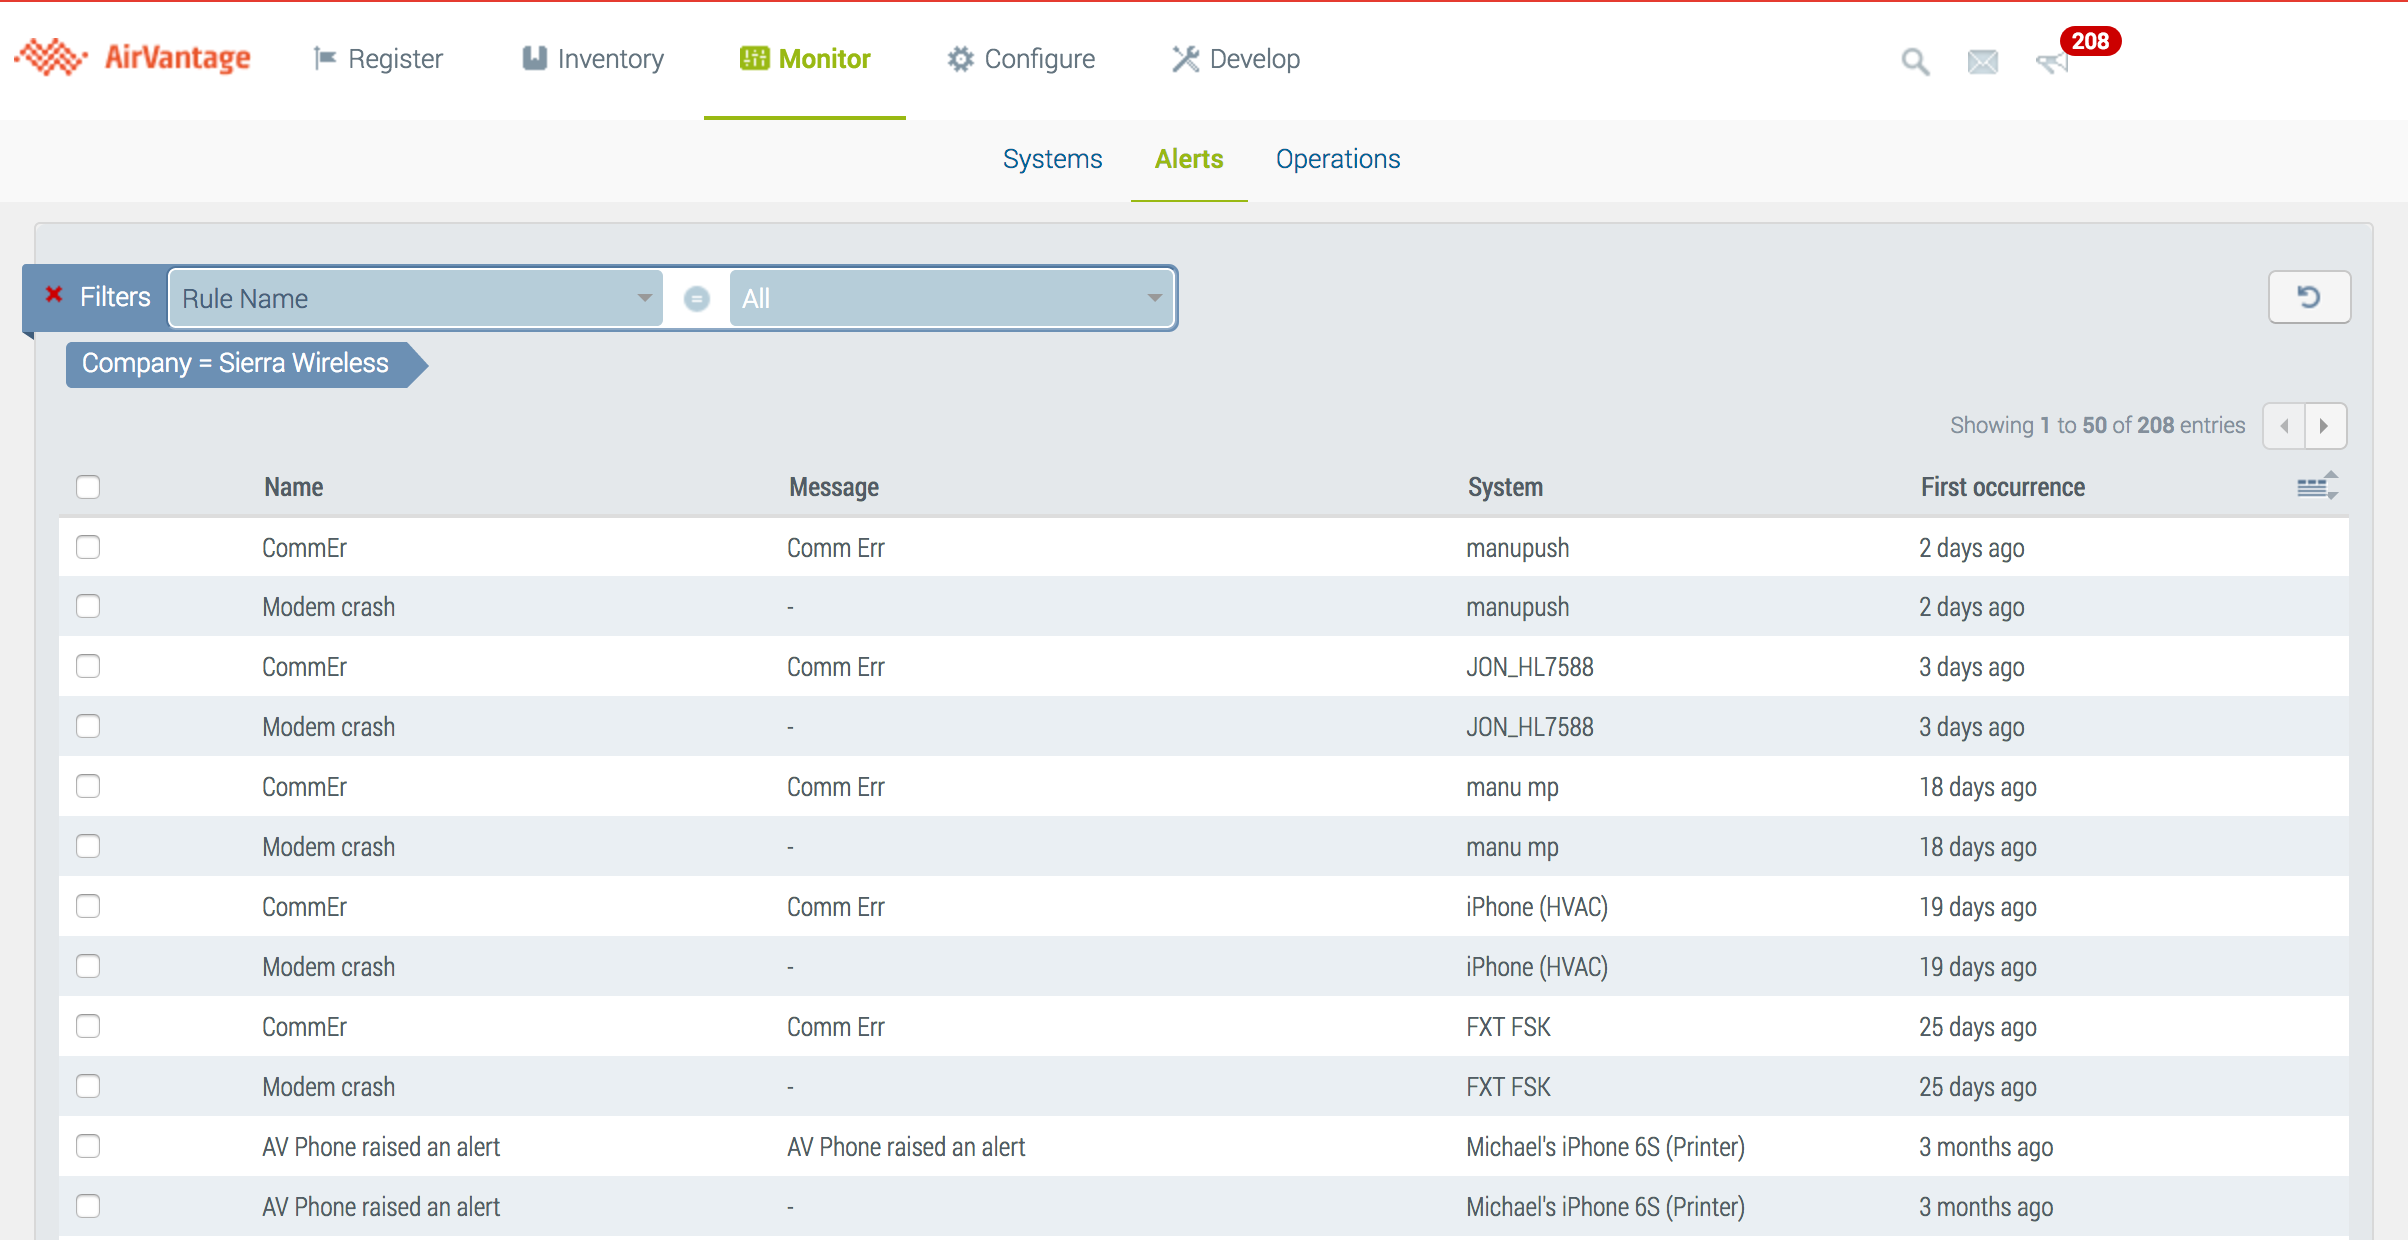
Alerts History
In Monitor > Alerts, all the current alerts are listed for troubleshooting. If you click on an alert, a dialog box shows you the details of the alert.
Building the dashboard
Now that you can detect system changes, you may want to have a single dashboard to show KPIs about your fleet and to drill down to a system’s dashboard.
Follow the steps below to define a dashboard for a system:
- Navigate to Monitor > System.
- Choose the referenced system you used to build your dashboard (all the system will share this dashboard).
- Click on the line to drill down into the system’s view.
- You can add or remove a widget, or change the size of some widgets by clicking on the top bar button. For more information about the dashboard, click here .
Follow the steps below to customize your fleet dashboard:
- Click on the top-left icon:
- Proceed similarly like for the system dashboard described above. By default, the widget shows the data aggregated for the entire fleet, but you can select a specific system.
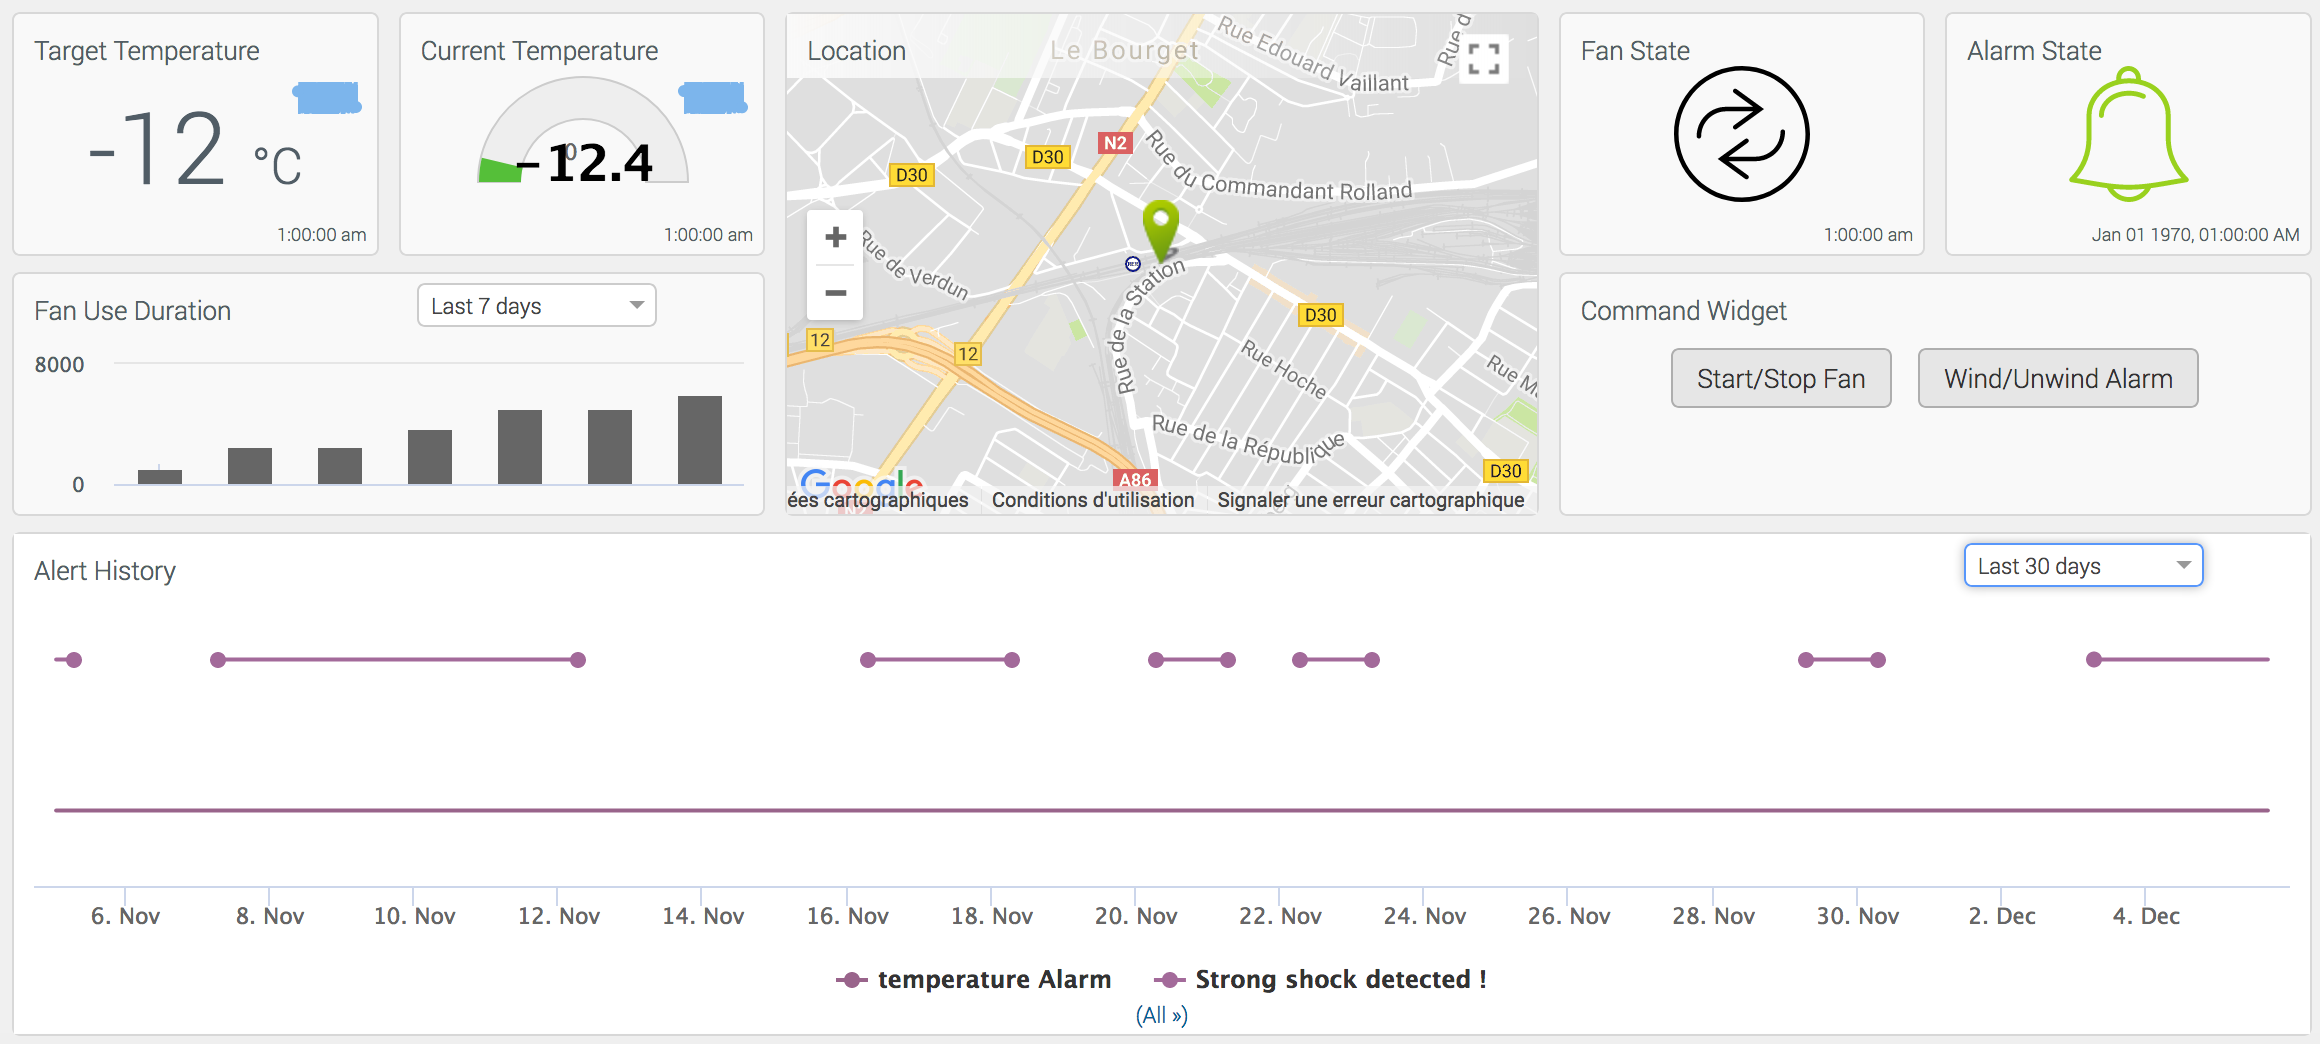
This dashboard contains the following widgets:
First Line (from left to right)
- Single Value Widget: Temperature (raw value), Unit: °C and precision set to 0, title: Target Temperature.
- Gauge widget: Current Temp (raw value), Precision: 2, minimum: -15, maximum: 20, threshold 1: -1, threshold 2: 5.
- Map Widget: No configuration required - shows truck location.
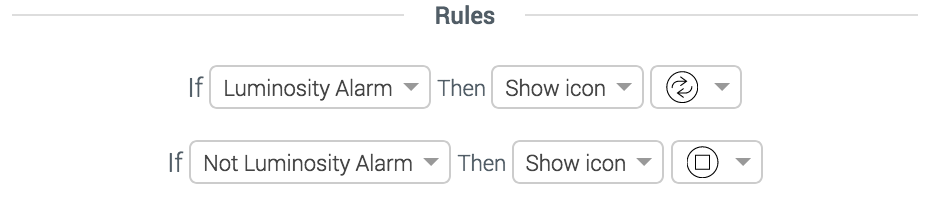
- Single Value Widget: Fan state (raw value), two rules to set an icon:
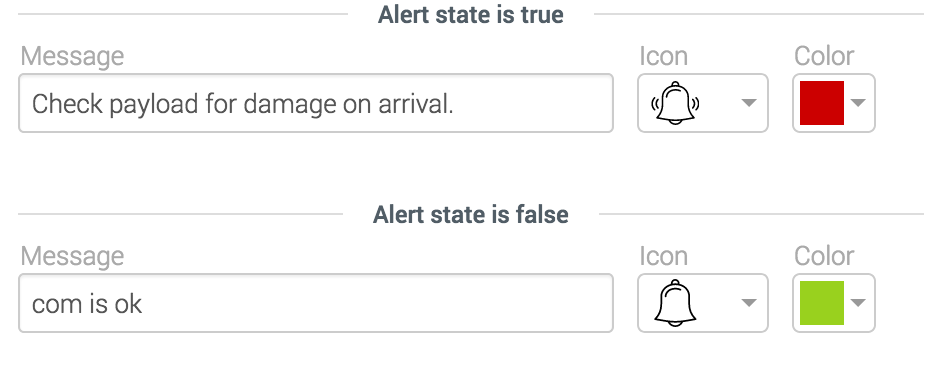
- Alarm State Widget: See the configuration on the right.
Second Line (from left to right)
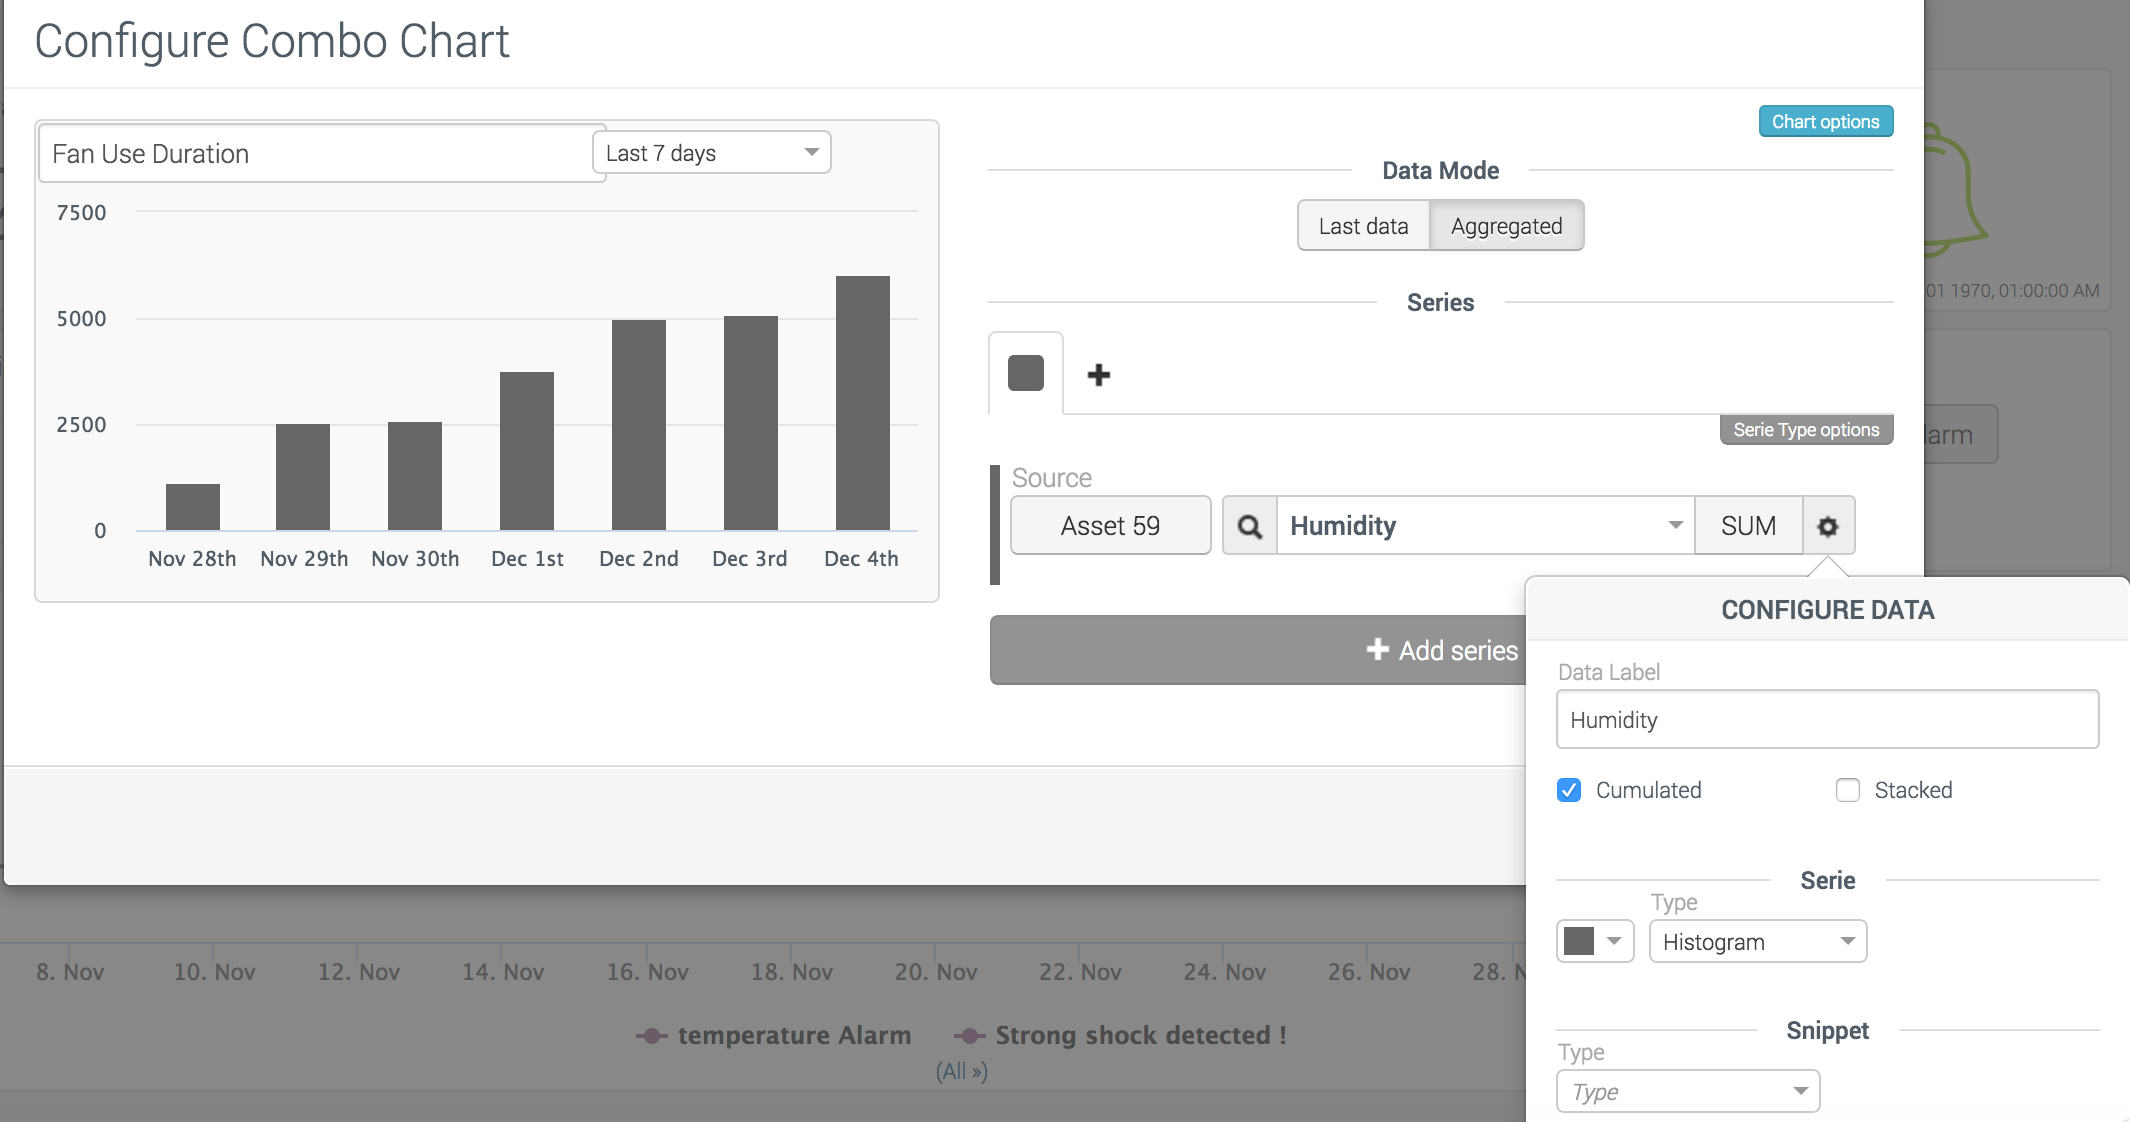
- Combo Chart Widget: Fan use duration with chart option to show the period browser (drop-down list). Select SUM aggregation and configure the option as shown in the screenshot on the right.
- Show the data configuration and select histogram type in the Series section; check Cumulated.
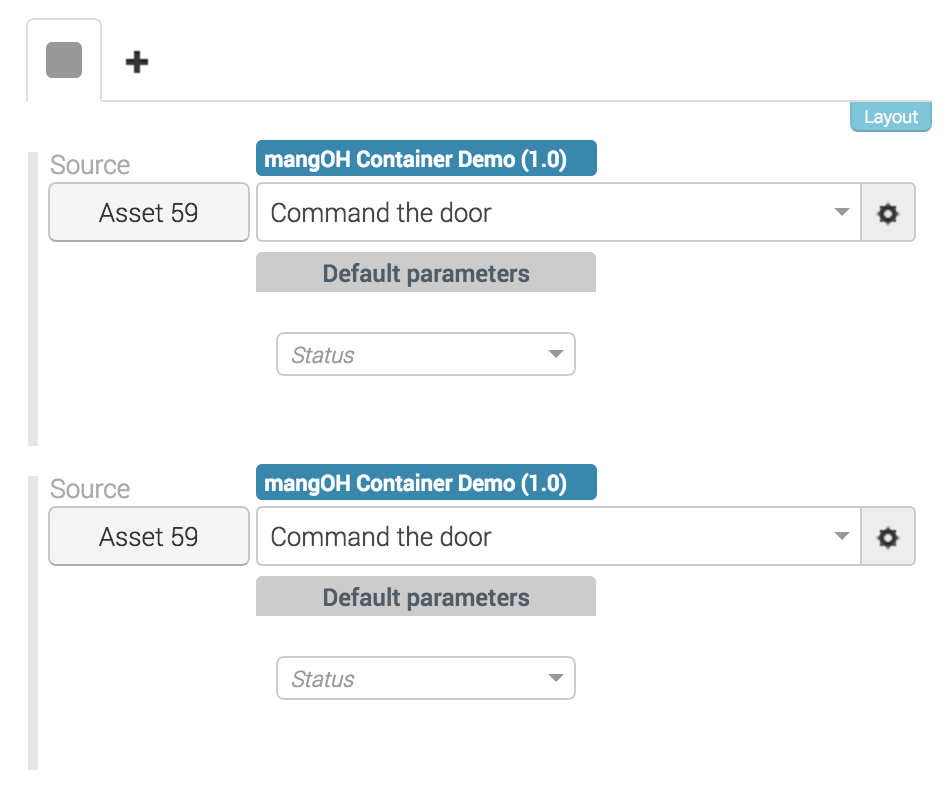
- Command widget: Based on the fan and alarm commands above.
- Add a new button for each command you want to access on a given line.
- Add a new tab if you want to add a new line.
- Configure the command associated to the button by selecting the application which manages the command and the command with the parameter. If no parameter is selected, all of the mandatory parameters will be required by the user.
Third Line:
- Alert history: This widget requires no configuration.
Next Step Once your system communicates correctly with AirVantage and data values can be browsed and displayed, you may want to get them into your specific application. Have a look to our AirVantage API to learn how to use these API to build powerful applications for your customer.