Using Network Diagnostics
Network Diagnostics tools are located at Networking > Diagnostics.
AirLink OS provides the following network diagnostic tools suite, including common and third-party tools:
 Initializing Table Of Contents...
Ping (Connectivity test)
The Ping tool (“ping”) tests whether a target device is reachable and indicates the round-trip time to send/receive data packets.

To use the Ping tool:
Configure the following fields in any order:
- DESTINATION — Enter the target device address in IPv4 or IPv6 format, or as a host name.
- DESTINATION RESOLUTION — Enter the DESTINATION’s IP address type (i.e., the DNS ‘resolution’ type):
- Auto — The router uses the default IP address type and then, if the DESTINATION is a hostname, uses the IPv4 or IPv6 address returned by the DNS.
- IPv4
- IPv6
- PACKET COUNT — Enter the number of packets to send for the test (1-100).
- PACKET SIZE — Enter the number of data bytes to send for each packet. (1-65507 bytes; default = 56)
- DON’T FRAGMENT — Control whether the system can fragment (break up) packets into smaller pieces for transmission. Disable this option to transmit fragmented packets, or enable it to transmit complete packets.
- SOURCE INTERFACE — Select the WAN interface or LAN Segment to use for the ping test. (The default interface is determined by the routing table.)
Click PING
 .
.
The test command and response appears in the output box.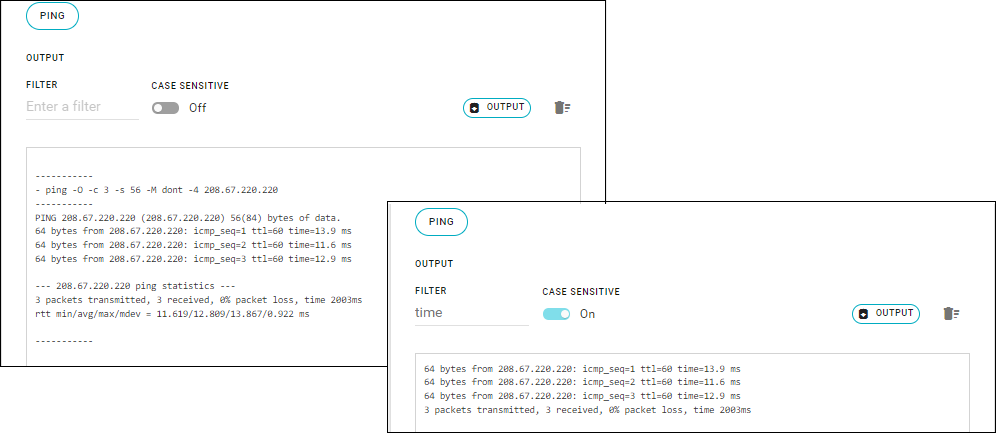
After the response appears in the output box (for one or more ping tests), you can:
- Search for a specific string in the output — Enter the string in the FILTER field and, if needed, select CASE SENSITIVE to show exact matches.
- Download the contents of the output box to a local file — Click OUTPUT
 .
. - Clear the output box — Click the clear output icon (
 ).
).
 .
.
 .
.Traceroute (Data path test)
The Traceroute tool (“traceroute”) traces the path that data packets take through the network to reach a target device.

To use the Traceroute tool:
Configure the following fields in any order:
- HOST — Enter the target device address in IPv4 or IPv6 format, or as a host name.
- HOST RESOLUTION to match the HOST’s IP address type:
- Auto — The router automatically determines (‘resolves’) the correct IP address type. This method is recommended when the HOST is a hostname instead of an IP address.
- IPv4
- IPv6
- SOURCE INTERFACE — Select the WAN interface or LAN Segment to use for the traceroute test. (The default interface is determined by the routing table.)
Click TRACEROUTE
 .
.
The test details appear in the output box.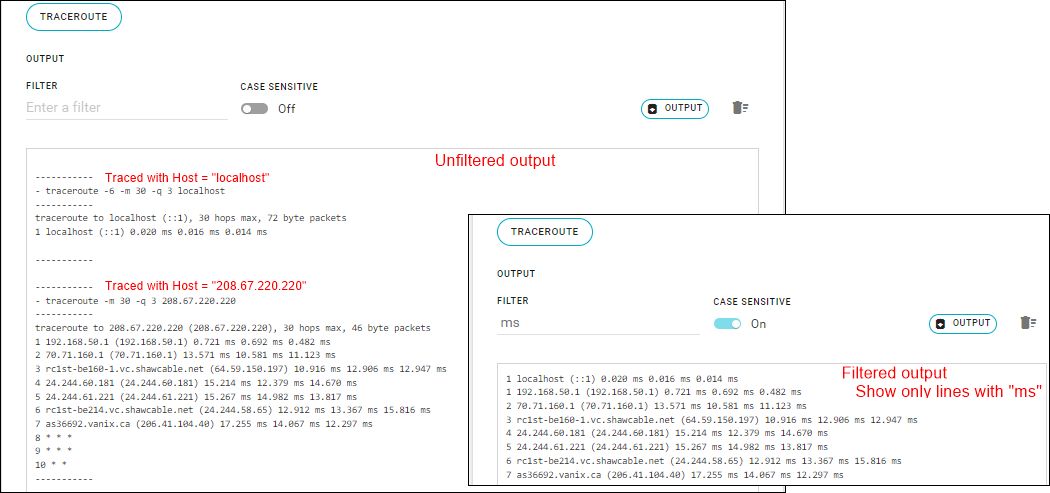
After details appear in the output box (for one or more traceroute tests), you can:
- Search for a specific string in the output — Enter the string in the FILTER field and, if needed, select CASE SENSITIVE to show exact matches.
- Download the contents of the output box to a local file — Click OUTPUT
.
- Clear the output box — Click the clear output icon (
).
 .
.
Iperf Client (Throughput test)
The Iperf tool (“iperf3”) tests the uplink or downlink network throughput (speed, bandwidth) between the router and a target device (host) over the default WAN interface.

To use the Iperf tool:
Configure the following fields in any order:
- HOST — Enter the target device address in IPv4 or IPv6 format, or as a host name.
- HOST PORT — Enter the port on the target device to use for the connection.
- HOST RESOLUTION to match the HOST’s IP address type:
- Auto — The router automatically determines (‘resolves’) the correct IP address type. This method is recommended when the HOST is a hostname instead of an IP address.
- IPv4
- IPv6
- TEST PROTOCOL — Select the communication protocol for the test: TCP or UDP.
- SIMULTANEOUS CONNECTIONS — Enter the number of parallel client data streams to use for the test (1-100).
- READ/WRITE BUFFER LENGTH — Enter the length of the buffer to read or write. (If no value is entered, TCP uses 128 KB, and UDP uses either a size dynamically determined based on the MTU or 1460 bytes otherwise.)
- WINDOW SIZE — The window size / socket buffer size used on both the client and server.
- BIT RATE — The target bitrate.
- PACKET COUNT BURST — Enter the number of packets that will be sent in each transmission in burst mode.
Configure Iperf to test either uplink or downlink throughput with the REVERSE option:
- Uplink test — Enable REVERSE.
- Downlink test — Disable REVERSE.
Click START
 .
.
The button changes to STOP and the test details appear in the output box.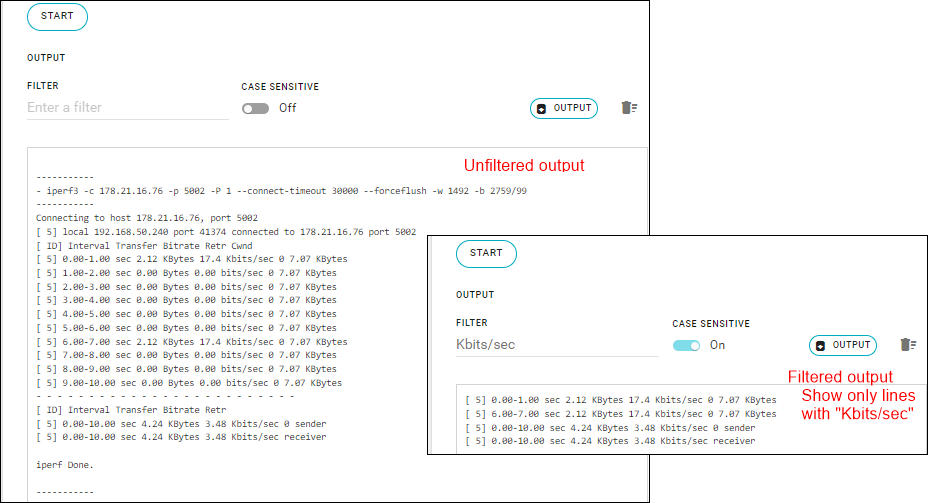
Wait for the test to complete or click STOP
 .
.You can now:
- Search for a specific string in the output — Enter the string in the FILTER field and, if needed, select CASE SENSITIVE to show exact matches.
- Download the contents of the output box to a local file — Click OUTPUT
.
- Clear the output box — Click the clear output icon (
).
 .
.
 .
.IP Capture (Network traffic test)
The IP Capture tool (“tcpdump”) captures network traffic going through the router.

To use the IP Capture tool:
Configure the following fields in any order:
- INTERFACE — Select the WAN interface or LAN Segment to use for the IP Capture test.
Note:- The default interface is determined by the routing table.
- Captures on a specific interface are done in promiscuous mode.
- If “Any” is selected, packets are captured in non-promiscous mode from all interfaces.
- PACKET SIZE — Enter the data packet size
- PACKET COUNT — Enter the number of packets to send for the test (1-1000000).
- PACKET FILTER INPUT MODE — Select a method for bulding a packet filter for the captured traffic:
- Basic — Filter the captured log using the following fields that appear when ‘Basic’ is selected (Note that when the test starts in step 3 below, the PACKET FILTER EXPRESSION is built automatically based on these fields.):
- IP/NETWORK — Include traffic only from selected IP/Networks, Reserved IP/Networks, or System IP/Networks.
Note:- IP/Networks are user-defined when creating firewall rules
- Reserved IP/Networks are user-defined when setting up DHCP reservations
- System IP/Networks are provided by the system in the device firmware
- SERVICES — Include traffic only using selected Services (communication protocols, e.g., TCP, UDP, etc.) or System Services (e.g., ALMS, ICMP, etc.).
- IP/NETWORK — Include traffic only from selected IP/Networks, Reserved IP/Networks, or System IP/Networks.
- Advanced — Build your own packet filter (using any tcpdump parameters). Enter the filter in the PACKET FILTER EXPRESSION field that appears when ‘Advanced’ is selected.
- Basic — Filter the captured log using the following fields that appear when ‘Basic’ is selected (Note that when the test starts in step 3 below, the PACKET FILTER EXPRESSION is built automatically based on these fields.):
- INTERFACE — Select the WAN interface or LAN Segment to use for the IP Capture test.
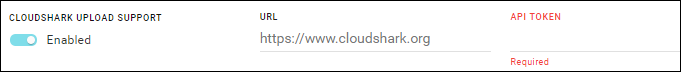
If you have registered for a Cloudshark account to perform packet analysis, enable CLOUDSHARK UPLOAD SUPPORT to automatically upload captured traffic to Cloudshark for analysis. Enter the cloudshark URL and API token for your Cloudshark account.
Click START
.
The test details appear in the output box.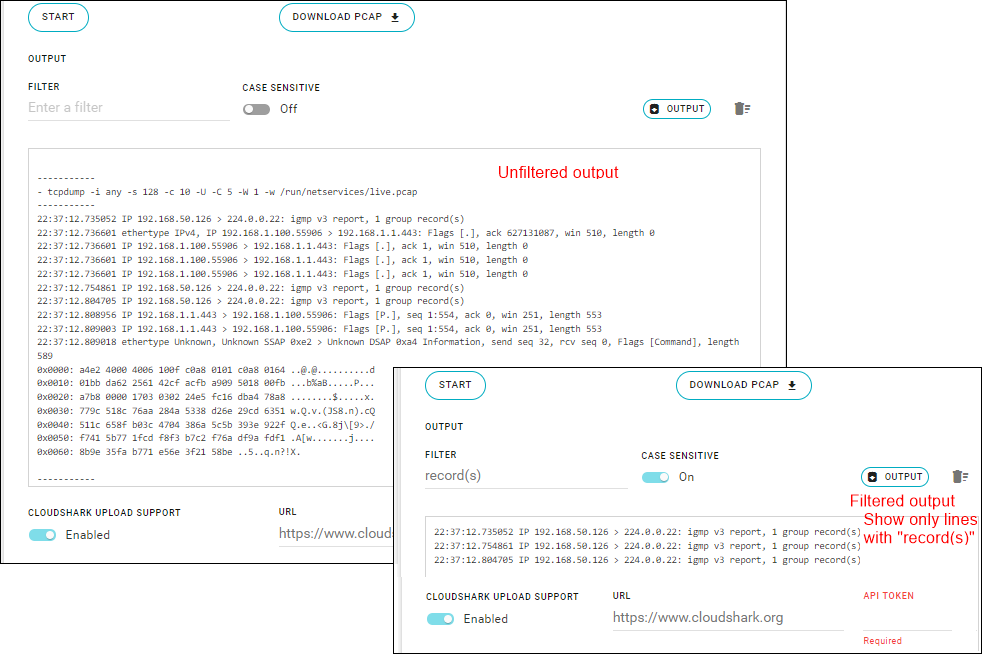
After details appear in the output box (for one or more iperf tests), you can:
- Download the captured traffic — Click DOWNLOAD PCAP
 .
. - Search for a specific string in the output — Enter the string in the FILTER field and, if needed, select CASE SENSITIVE to show exact matches.
- Download the contents of the output box to a local file — Click OUTPUT
.
- Clear the output box — Click the clear output icon (
).
- Download the captured traffic — Click DOWNLOAD PCAP


 .
.Radio Module Log (Radio Module Logging)
The Radio Module Log tool captures cellular radio module logging data. This tool is intended for use only when Sierra Wireless requests it be run for debugging purposes. (Note — This tool appears only locally; it is not available when accessing the router from ALMS.)

To use the Radio Module Log tool:
Configure the following fields in any order:
- RADIO — The cellular radio from which logs will be captured.
- DESTINATION — The location where logs will be saved:
- Local — Store data on the router. Configure the following fields:
- LOCAL CAPTURE MAX SIZE — The maximum amount of data that can be captured. (Maximum size is 10 MB)
- LOCAL CAPTURE DURATION — The maximum time that the capture session can run.
- CURRENT FILTER — Filter the captured log using the ‘default’ filter or click UPLOAD FILTER
 to use a different one provided by Sierra Wireless.
The data capture session stops when the maximum capture size is reached or the capture duration is reached.
- Remote — Store data on a TCP server. Configure the following fields:
- REMOTE CAPTURE MAX SIZE — The maximum amount of data that can be captured. (Maximum size is 10 GB)
- REMOTE CAPTURE DURATION — The maximum time that the capture session can run.
- SERVER ADDRESS — Enter the server’s address in IPv4 or IPv6 format, or as a host name.
- SERVER PORT — Enter the port on the server to use for the connection.
- CURRENT FILTER — Filter the captured log using the current ‘default’ filter or click UPLOAD FILTER
to temporarily replace the default filter with a different one provided by Sierra Wireless. (Note — The current filter persists (remains in effect) until either a new filter is selected or until the router is power cycled (rebooted), whichever comes first.)
- Interactive — Live QXDM logging over the TCP connection. Configure the following fields:
- SERVER ADDRESS — Enter the server’s address in IPv4 or IPv6 format, or as a host name.
- SERVER PORT — Enter the port on the server to use for the connection.
- Local — Store data on the router. Configure the following fields:
Click START
.
If the capture starts successfully, the button changes to STOP; if there is a problem, the LAST ERROR field appears with a short description of the problem.At any time, click STOP
to finish the capture.
If the capture DESTINATION was Local, click DOWNLOAD LOG to save the log to your computer.
 to use a different one provided by Sierra Wireless.
 to save the log to your computer.