How to retrieve device data in a dataset?
AirVantage allows you to retrieve firmware data from your AirLink gateways.
Follow this tutorial to learn how to create datasets to retrieve the firmware parameters from your gateways, and how to use the scheduling functionality to automate the operation.
To watch the video version, click on the screen above.
Or, if you prefer, follow the steps below at your own pace.
Step 1: Create Dataset
In AirVantage terminology, a “Dataset” is a list of ALEOS parameters that a user would like retrieved from their gateways. For systems with the heartbeat configured when communicating to AirVantage for the first time, the device will be associated to a default status report. It includes information such as RSSI, GPS latitude, longitude, IP address and other common information. To access additional data from your gateways, you must create a dataset that contains the specific parameters you want retrieved.
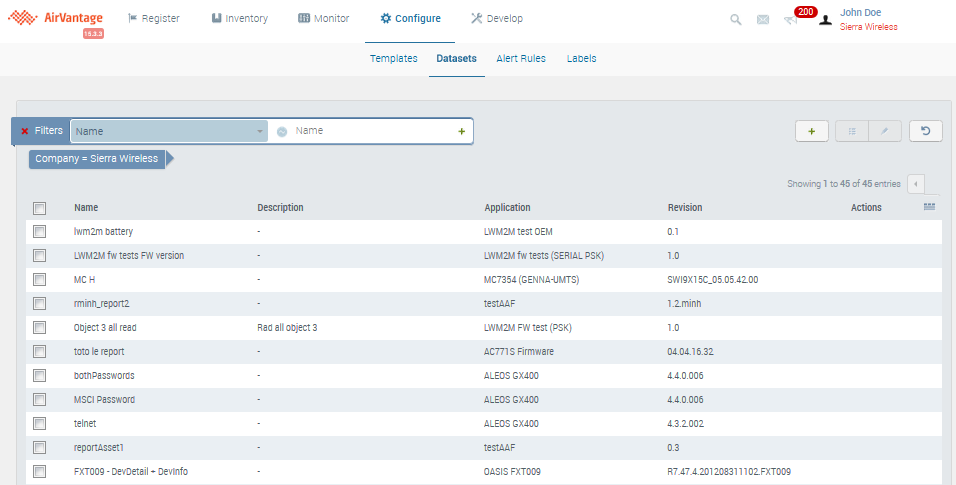
Create a new dataset
Let’s start by creating a new dataset. Datasets are managed from the Configure screen under the Datasets tab.
From here, you can see all of the datasets available and you have the ability to modify them. To create a new dataset, just click on the “plus” icon.
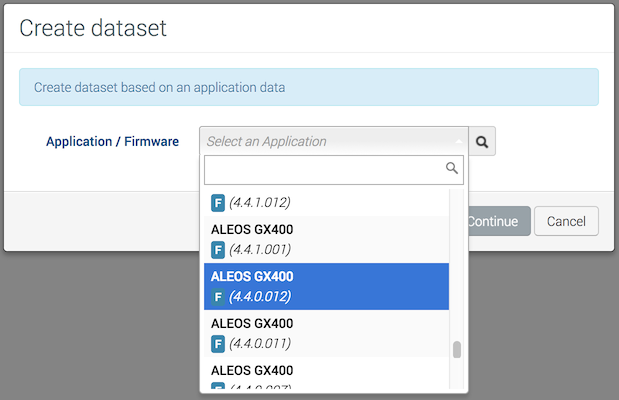
Because datasets are bringing back specific ALEOS parameters, we need to first select the firmware version we want this dataset associated with. We’ll select the ALEOS firmware of our GX400 gateway.
Search your parameters
Based on the firmware version selected, you are now presented with the ALEOS parameters available. From here, you can browse and select the parameters you wish to make part of the dataset.
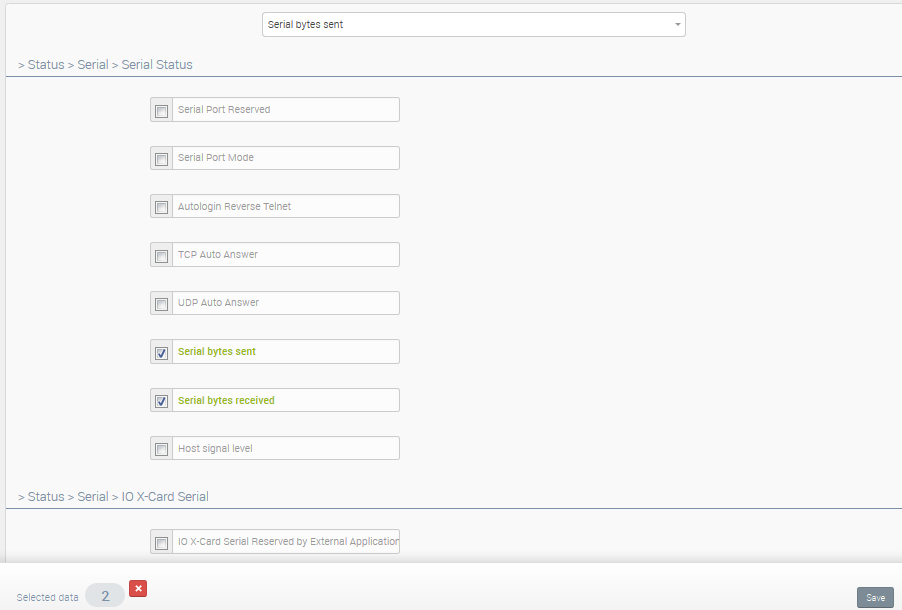
To find a parameter to be included in your dataset, you can either enter its name in the search field, or browse through the hierarchy For example, let’s use the search field to find the Serial Port status parameters.
Select your parameters
As you type, the list of parameters is refined, and you are presented with the matches in green. Select the parameter to include in the dataset. A counter at the bottom of the screen is automatically incremented. It indicates the number of parameters you’ve added to the dataset. A red “x” also allows you to unselect all of them.
Alternatively, back at the configuration root page, you can also browse through the hierarchy to get to the same parameters.

Save your dataset
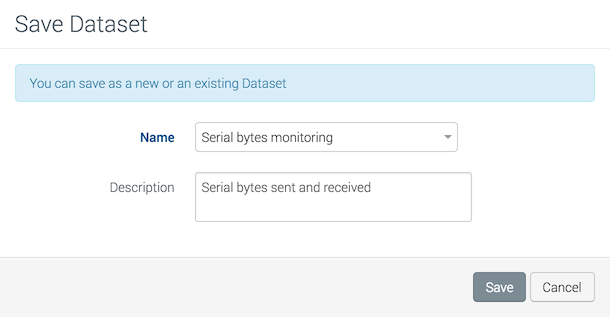
Choose the parameter selection method that best suits your dataset requirements. When you are happy with your dataset, click on Save, name your dataset and optionally describe it.
A message block indicates that the dataset has been successfully created.
You can now use your dataset in 2 ways. You can request the dataset as needed or you can schedule it.
Step 2: Retrieve Dataset
To manually retrieve the dataset from a device, let’s find our target device in the list of systems.
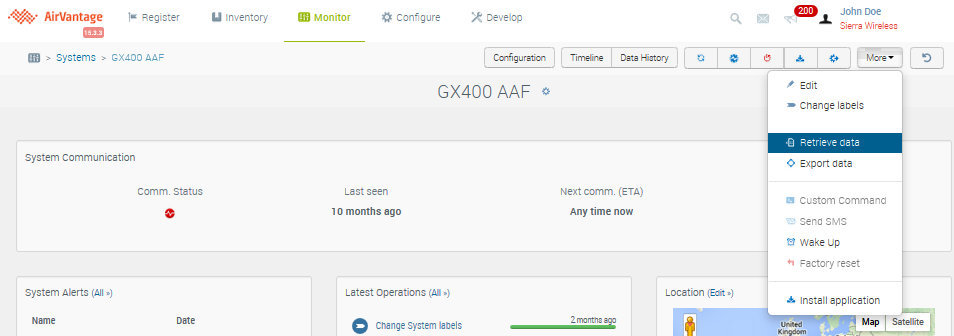
Select the dataset to use
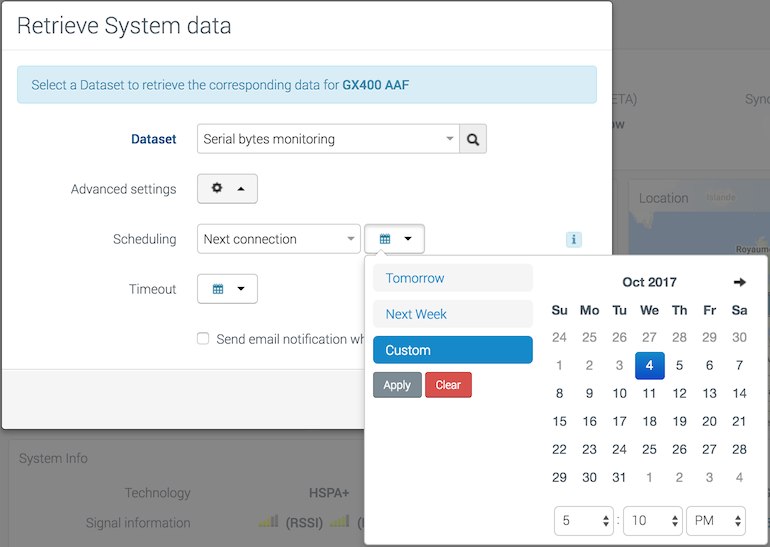
Open the Monitor > Systems list, find your system in the list and check it. Then select the Retrieve > Device data command from the More button on the Action Menu, also available on the system’s Monitor page.
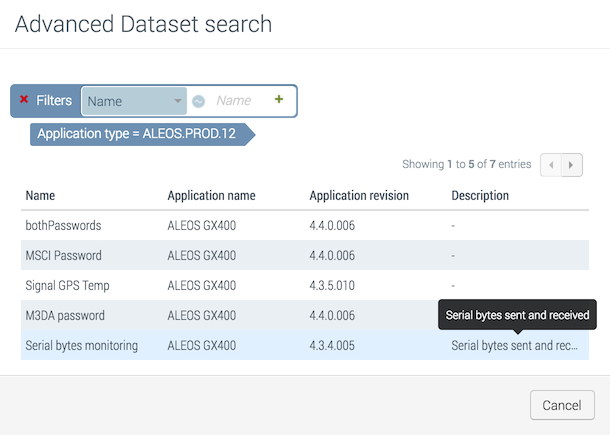
You can find the dataset just created in the list.
Request a dataset
- Either ask for it at the next connection or set a specific schedule for it.
- A message box confirms that an operation to retrieve your data has been initiated.
- You can track the progress of the dataset in the Latest Operations list on the system details page.
Schedule a dataset
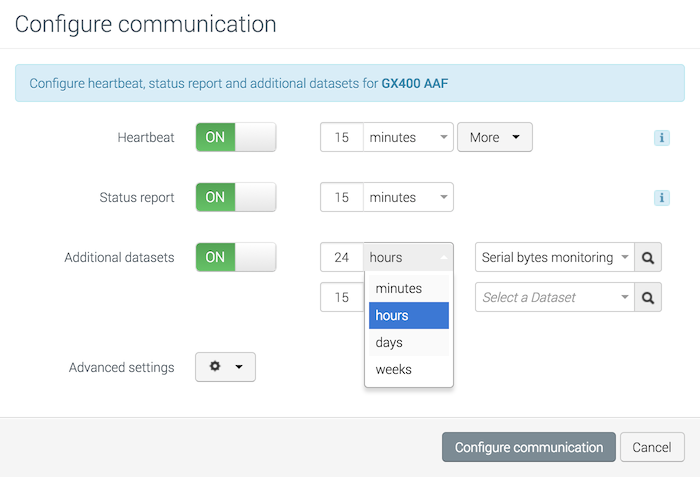
Alternatively, you can schedule datasets to be retrieved repeatedly. This feature is available from the Configure Communication panel.
Note the Advanced option, which allows you to pick the dataset as well how frequently you want it retrieved.
Now your dataset has been requested, you can see it in the recent operations list for your system:
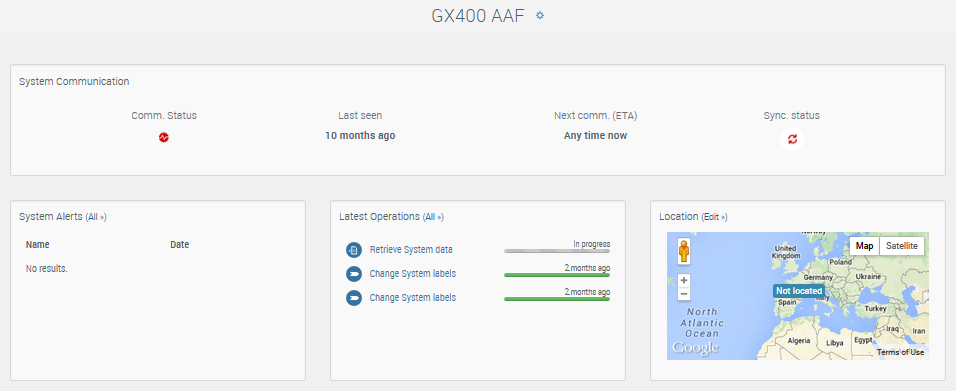
Step 3: Use your Data
View your dataset
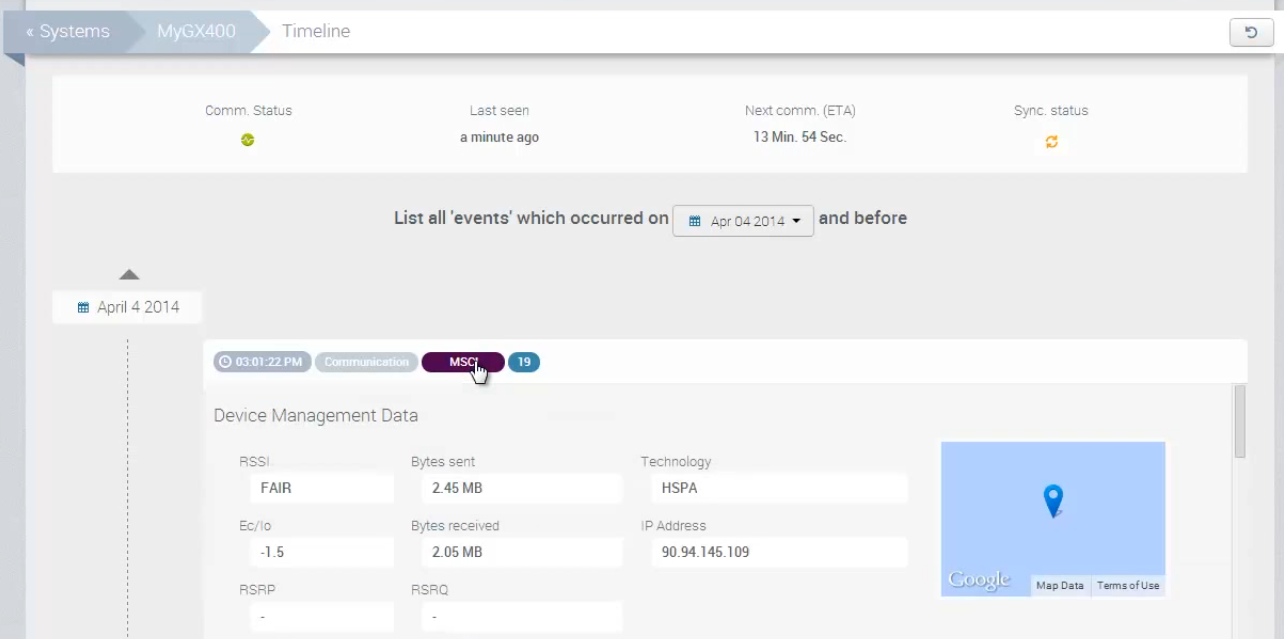
Once the dataset has been retrieved, the data will be available on the Timeline page. The Timeline lists all your system communications with AirVantage over a 3-month period. To view your dataset, identify the most recent communication in your timeline, click on it, and the dataset data will be displayed.
Display your data
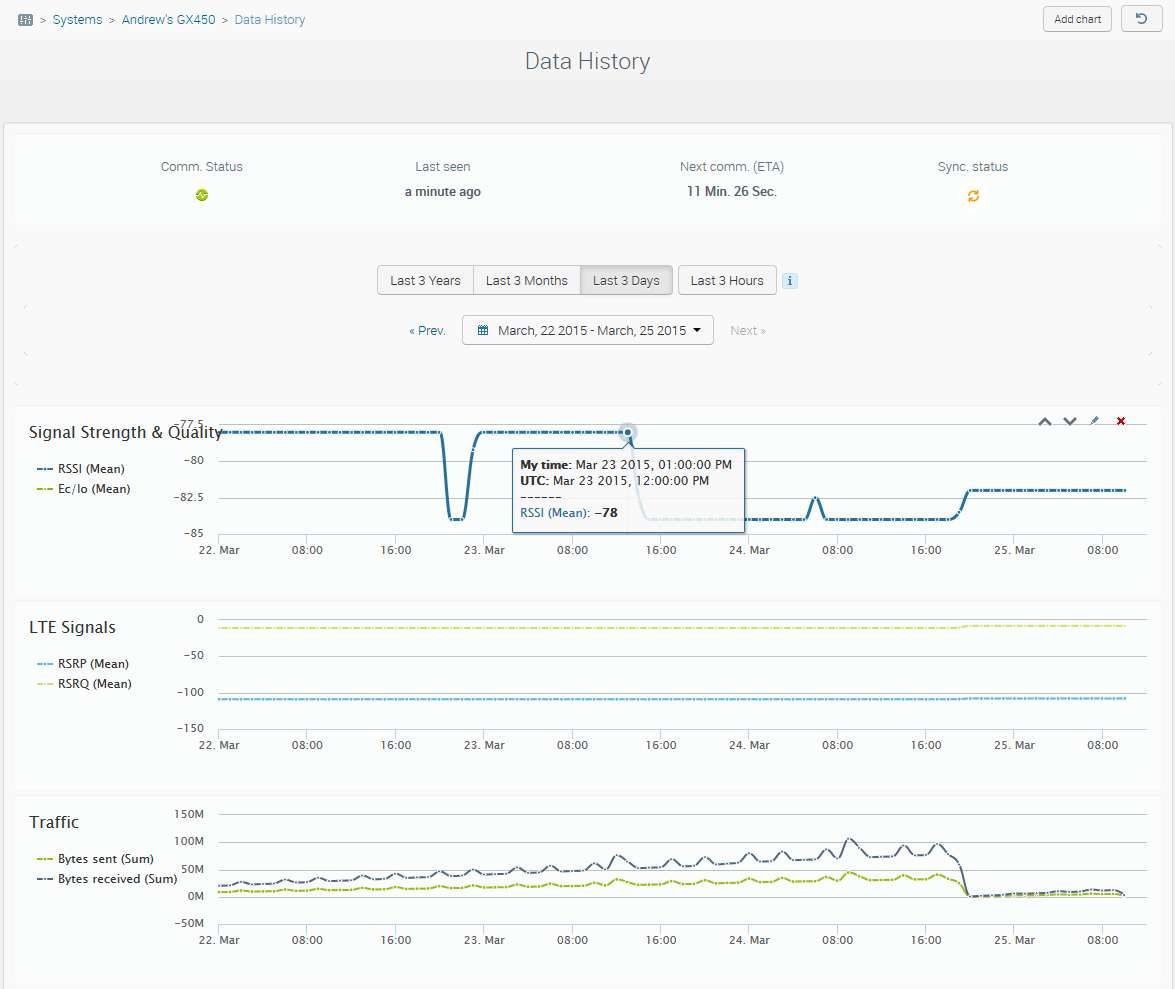
Apart from the Timeline, you can also use the Data History screen to analyze the dataset data.
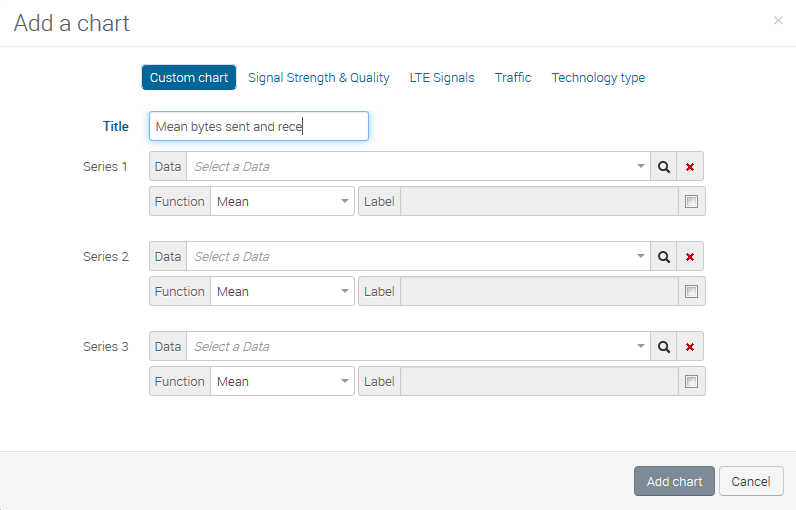
From the Data History page, you can use the Add chart button to define graphical charts that allow you to review the dataset data retrieved during specific time periods.
For instance, we want to review the ALEOS parameters: Bytes Sent and Bytes Received. Each of these data items will form a series in the chart.
Click on Add Chart to start, then select the Custom Chart (or Traffic) tab.
For each series, select the source data item, and the mathematical function to apply to it. In this case, we want to know the “mean” value of these parameters.
Click on Add chart.
You can add multiple charts to the Data History page, to present a multi-dimensional view of the system.
Several charts are provided “out of the box”, including Signal Strength and LTE Signals, and Traffic.
Once you have added your chart(s) to the page, you can select the time period to display, such as hourly, daily or monthly, to get the level of detail you need.
 Searching...


