 Searching...
How to Work With and Create Driver Behavior Reports
The Driver Behavior report describes the behavior of your fleet in terms of driving-related incidents over the course of the reporting period. The report tracks the following incidents:
- Hard Accelerations
- Hard Decelerations
- Cornering
- Speeding
Driver behavior reports require inertial sensors on the router (as supported on the MP70 and XR series), and will not be reported on an AirLink GX450 or LX60.
Incidents are triggered by exceeding configured (hard acceleration, hard deceleration, cornering) or posted thresholds (speeding) at the given location at the time of the incident. The report results include the ranking of the devices in a fully interactive data table and details of each incident that can be viewed in a fully interactive map.

By default, all incident types are initially tracked. To filter out types of incidents displayed, click the buttons along the top of the map.

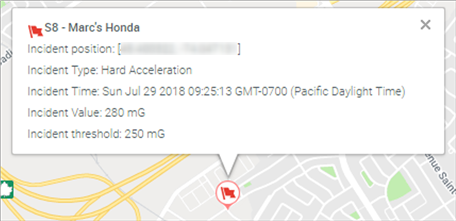
On the map, you can click an incident icon to view the full details of the incident (including coordinates, incident time, incident value and incident threshold).
Groups of incidents located closely together are indicated in numbered circles. Click a circle to zoom in on a group of incidents.
Groups are color coded by size:
Blue: 1 to 9 incidents
Yellow: 10 to 99 incidents
Red: 100 to 999 incidents
Purple: 1,000+ incidents

Creating a Driver Behavior Report
To begin, from the Reporting dashboard, click the Create a New Report icon.
An empty report screen appears.
Select a Template
Choose how often you’d like this report to be run. Click:
Single for a one-time report
Weekly
Monthly
Yearly
Under Report Properties, you can complete the scheduling for your new report. The section below describes how to configure the time and the day on which you’d like your report to run.
To run a report immediately, click Run Report.

Define the Report Properties
The required fields for creating a valid report are Type, Name and Range.
Select the Report Type
Select Driver Behavior from the Type menu.

Enter a Name and Description
Give your report a brief, descriptive name. You may want to use a driver’s name, a vehicle model, and/or the AirLink gateway or router model, depending on the type of report you run.
Below the Name field, you can enter a longer report description. You may want to include the report’s schedule and reporting zone.
Select the Reporting Range
The Range menu lists the options for the reporting period. You can select a predefined Reporting Range, or configure a Custom range.
If scheduling a recurring report, select one of the relative date ranges (Yesterday or Last 7 Days, for example). Selecting an absolute range will generate the same results each time.
If you click Custom, a calendar appears, allowing you to select a start date/time and an end date/time for your report.

Select Recipient Email Addresses
Click the Recipient Emails field to select the people you would like to be notified when the report is run.
You can also manually enter email addresses in this field.

Configure Zones
For Driver Behavior reports, you can specify inclusion and exclusion zones.
Any location data or vehicle incident data collected outside the “Include” zones is filtered out of the report results.
Any location data or vehicle incident data collected inside the “Exclude” zones is filtered out of the report results.

If the inclusion and exclusion zones overlap, the “Include” filter is applied first, followed by the “Exclude” filter.
The zones available to you are defined in the Configure > Zones section.

For more information, see How to Create a Zone .
Select the Export File Formats
Reports can be exported as PDF, Excel (.csv) or KML files, depending on the type of report you are generating.
Exported KML files are available for the Driver Behavior reports.
To select export file formats, click the appropriate buttons.

Select Units and Speeding Tolerance
You can fine tune some parameters to optimize your report results.
You can choose to render your reports in metric or imperial units.

For Driver Behavior reports, you can select the Speeding Tolerance. When the gateway or router detects the vehicle speed over this percentage over the posted speed limit (determined by Google Maps Roads API), a speeding event is reported. Use the Speeding Tolerance setting to filter out events that are of limited value in deciding if a vehicle was speeding. Common values are 15% or 20% to eliminate driving variance.

The accuracy of speed limit data depends on the accuracy of Google’s data. If you find that a road’s actual posted speed limit differs from Google Maps, you can report the error to Google. Instructions are available here.
Select the Systems
Select the systems for which you want to run your new report. Select checkboxes for the desired system(s), or filter the list to narrow down your choices. You do not need to use the checkboxes to select specific systems. Selecting the checkboxes will override general filters.

Select Advanced Settings: Start and End Dates
The Advanced settings are strictly optional. If you enable these settings, you may want to set a reminder (external to ALMS) to notify yourself of the start and end dates.
Click the Advanced button to display options for selecting start and end dates for your reports. For example, you can configure a weekly report to run for two months starting one week from today.
Clicking Start Time or Run Until displays a calendar on which you can define a start date/time and end date/time.
